


 21 / 50

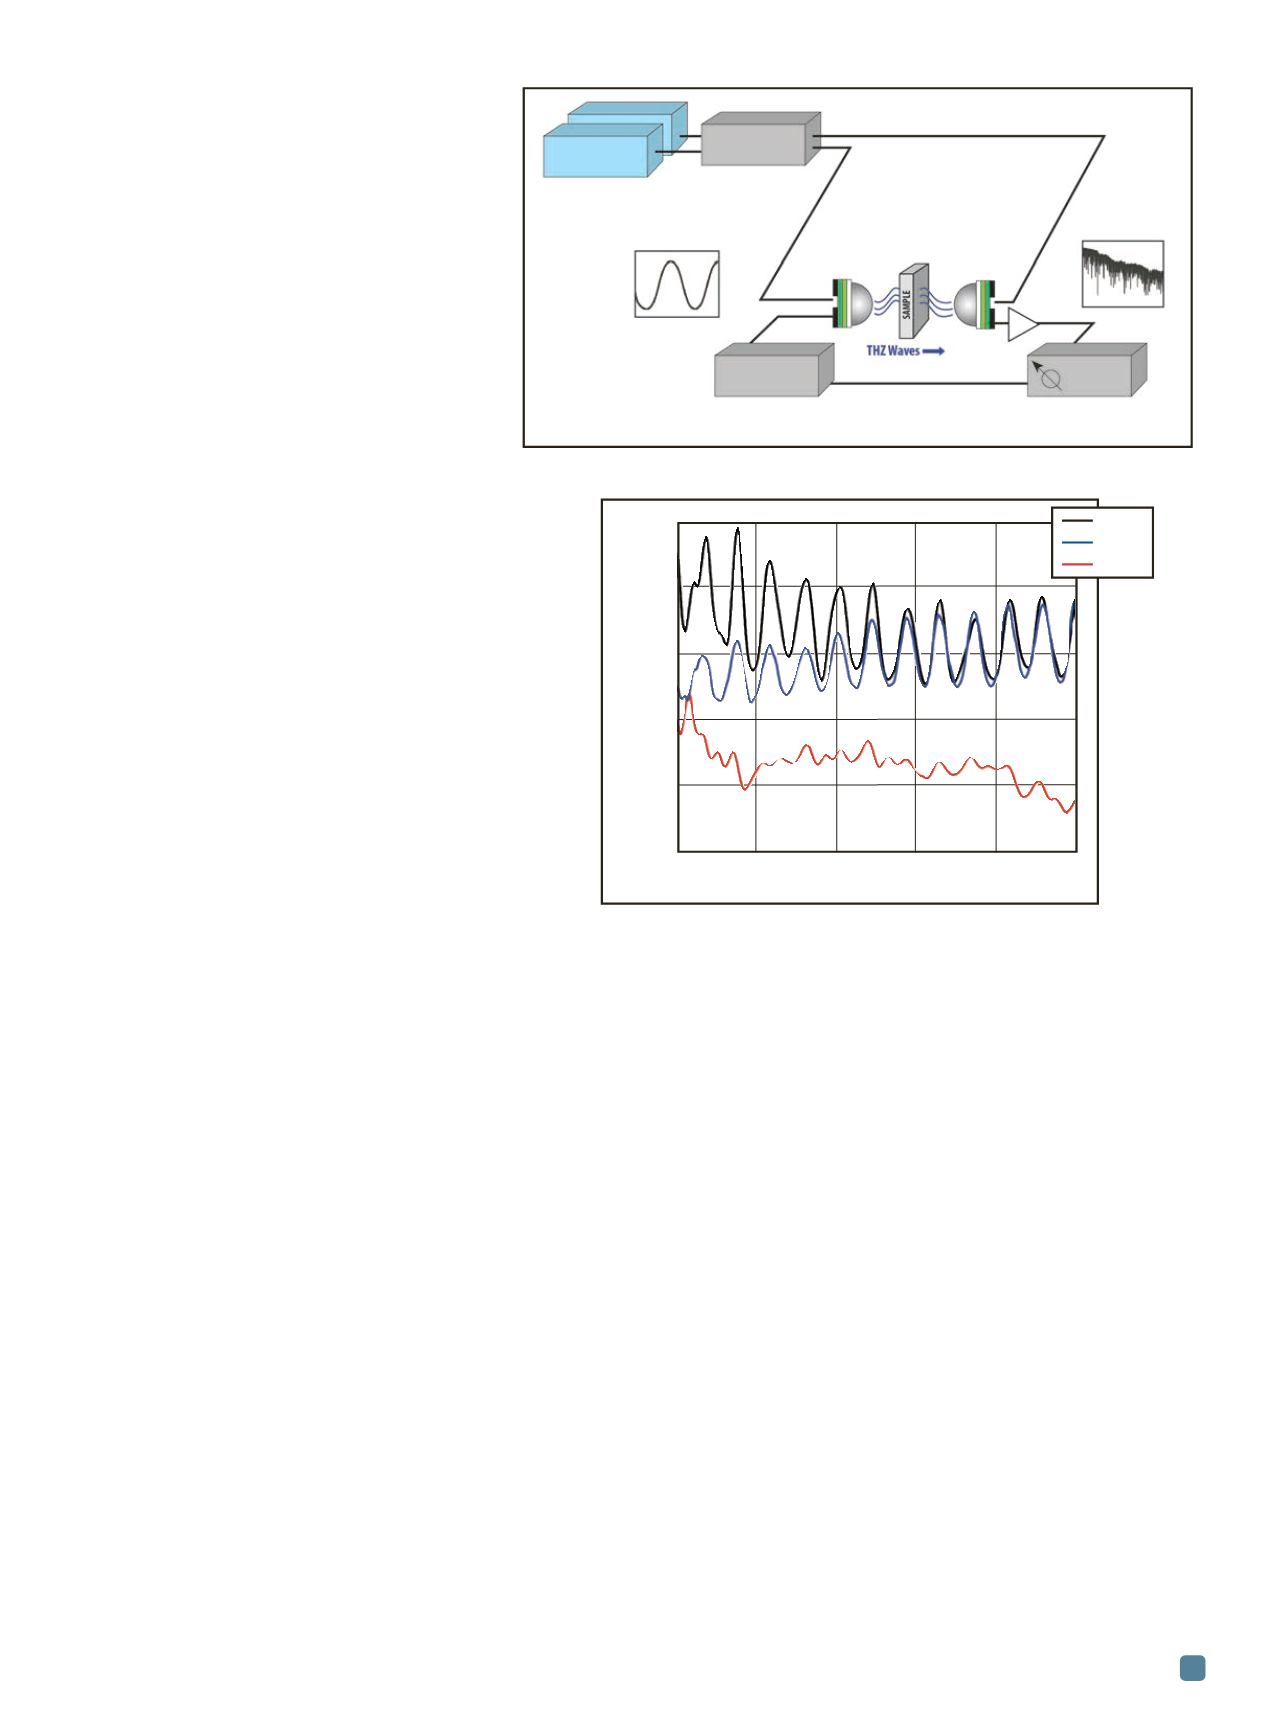
tinuous wave
(CW)-based THz spectroscopy sys-
tems place the optics inside the cryostat. CW-
THz spectroscopy uses two distributive feedback
lasers tuned to slightly different wavelengths.
Mixing the light emitted by the lasers results in an
intensity-modulated (with 0.2 to 1.5 THz modu-
lation frequency) IR light source that is transmitted to
fiber-coupled photomixer devices. Each photomixer con-
tains a planar, broadband antenna patterned on an ultra-
fast photoconductive substrate and centered on a silicon
dome lens. THz generation and detection is achieved with
the IR light by modulating the conductance of the antenna
with an integrated, semiconducting photoswitch. The
cryogenically compatible THz emitters and detectors are
contained in an insert that fits the narrow bore of a high-
field magnet, in close proximity to tested materials. THz
transmission spectra are acquired at temperatures from
5 to 300 K, and up to a 9 T magnetic field. Dome-shaped
emitters and detectors are mounted on thermally stable,
optical stages that maintain THz alignment while meas-
urements are taken at variable temperatures.
Case study: CW-THz magneto-spectroscopy
A researcher exploring new growth methods for a par-
ticular semiconductor already employs a host of conven-
tional optical spectroscopy techniques to characterize
materials, such as x-ray spectroscopy to gather informa-
tion about crystal structure and UV-visible technologies
to determine the band gap. THz characterization can aug-
ment the information derived by conventional optical
measurements, particularly when trying to determine tem-
perature-dependent conductivity.
Traditionally, by calculating the transmission and re-
flection from each interface of a wafer, the THz-frequency,
complex-valued refractive index is extracted from the THz
spectra of the material. The contribution of free carriers
to the permittivity is then modeled with a simple but fairly
accurate Drude model. However, in the absence of a mag-
netic field, extracting the electronic material parameters
requires knowledge of both carrier type and band mass
from other techniques.
Stimulating semiconductor materials at THz frequen-
cies and in high field can reveal interesting properties that
other techniques miss. For example, with InSb and other
high-mobility materials, CW-THz magneto-spectroscopy
can determine the cyclotron resonance condition in these
materials. Band mass can be directly measured by map-
ping out the field dependence of the cyclotron resonance
frequency shift while the resonance linewidth can provide
an estimate of material mobility.
For many larger band mass carriers, where a THz-fre-
quency cyclotron resonance condition cannot be easily
met, THz magneto-spectroscopy can still reveal carrier
type and mobility. Owing in part to the circularly polar-
ized nature of CW-THz emission, electrons and holes be-
have differently in a magnetic field and result in an
asymmetric (with field) permittivity of the material. As
shown in Fig. 2, P-type silicon exhibits strong absorption
in the THz band at negative fields and enhanced transmis-
sion at positive fields. Conversely, N-type materials show
strong absorption at positive fields. Efforts are currently
underway to develop a mobility extraction algorithm from
field dependent CW-THz measurements.
Moving to the device stage
Nondestructive cryogenic testing can also play an im-
portant role later in the development cycle, such as when
it is necessary to performmeasurements on fabricated, on-
wafer samples. Once research advances to the point of de-
vice construction, a cryogenic probe station enables
multiple contact points for device biasing and signal meas-
urement on a flexible, variable-temperature platform. The
task of dicing fully fabricated wafers and bonding wire to
the dissected piece for device characterization is no longer
required, as in a conventional cryostat. Repositionable,
micro-manipulated probes are used instead, eliminating
the need for large, fixed-wire contacts and enabling multi-
ADVANCED MATERIALS & PROCESSES •
OCTOBER 2014
21
Fig. 1
—
Continuous wave-THz spectroscopy system.
(2) Low-cost distributed
feedback lasers
Coupler
Range of THz frequencies,
one at a time
Bias voltage
Lock-in
amp
Spectrum
(real time)
Fig. 2
—
Field dependent THz spectra of a B-doped silicon
substrate.
1.0
0.8
0.6
0.4
0.2
0.0
THz transmission
0.2
0.4
0.6
0.8
1.0
1.2
Frequency, THz
100 K
+7.5 T
0 T
-7.5 T