


 24 / 50

ADVANCED MATERIALS & PROCESSES •
OCTOBER 2014
24
the capacity to analyze and reanalyze
data, makes DIC a great teaching tool
for materials science and engineering
courses at the university level. A good
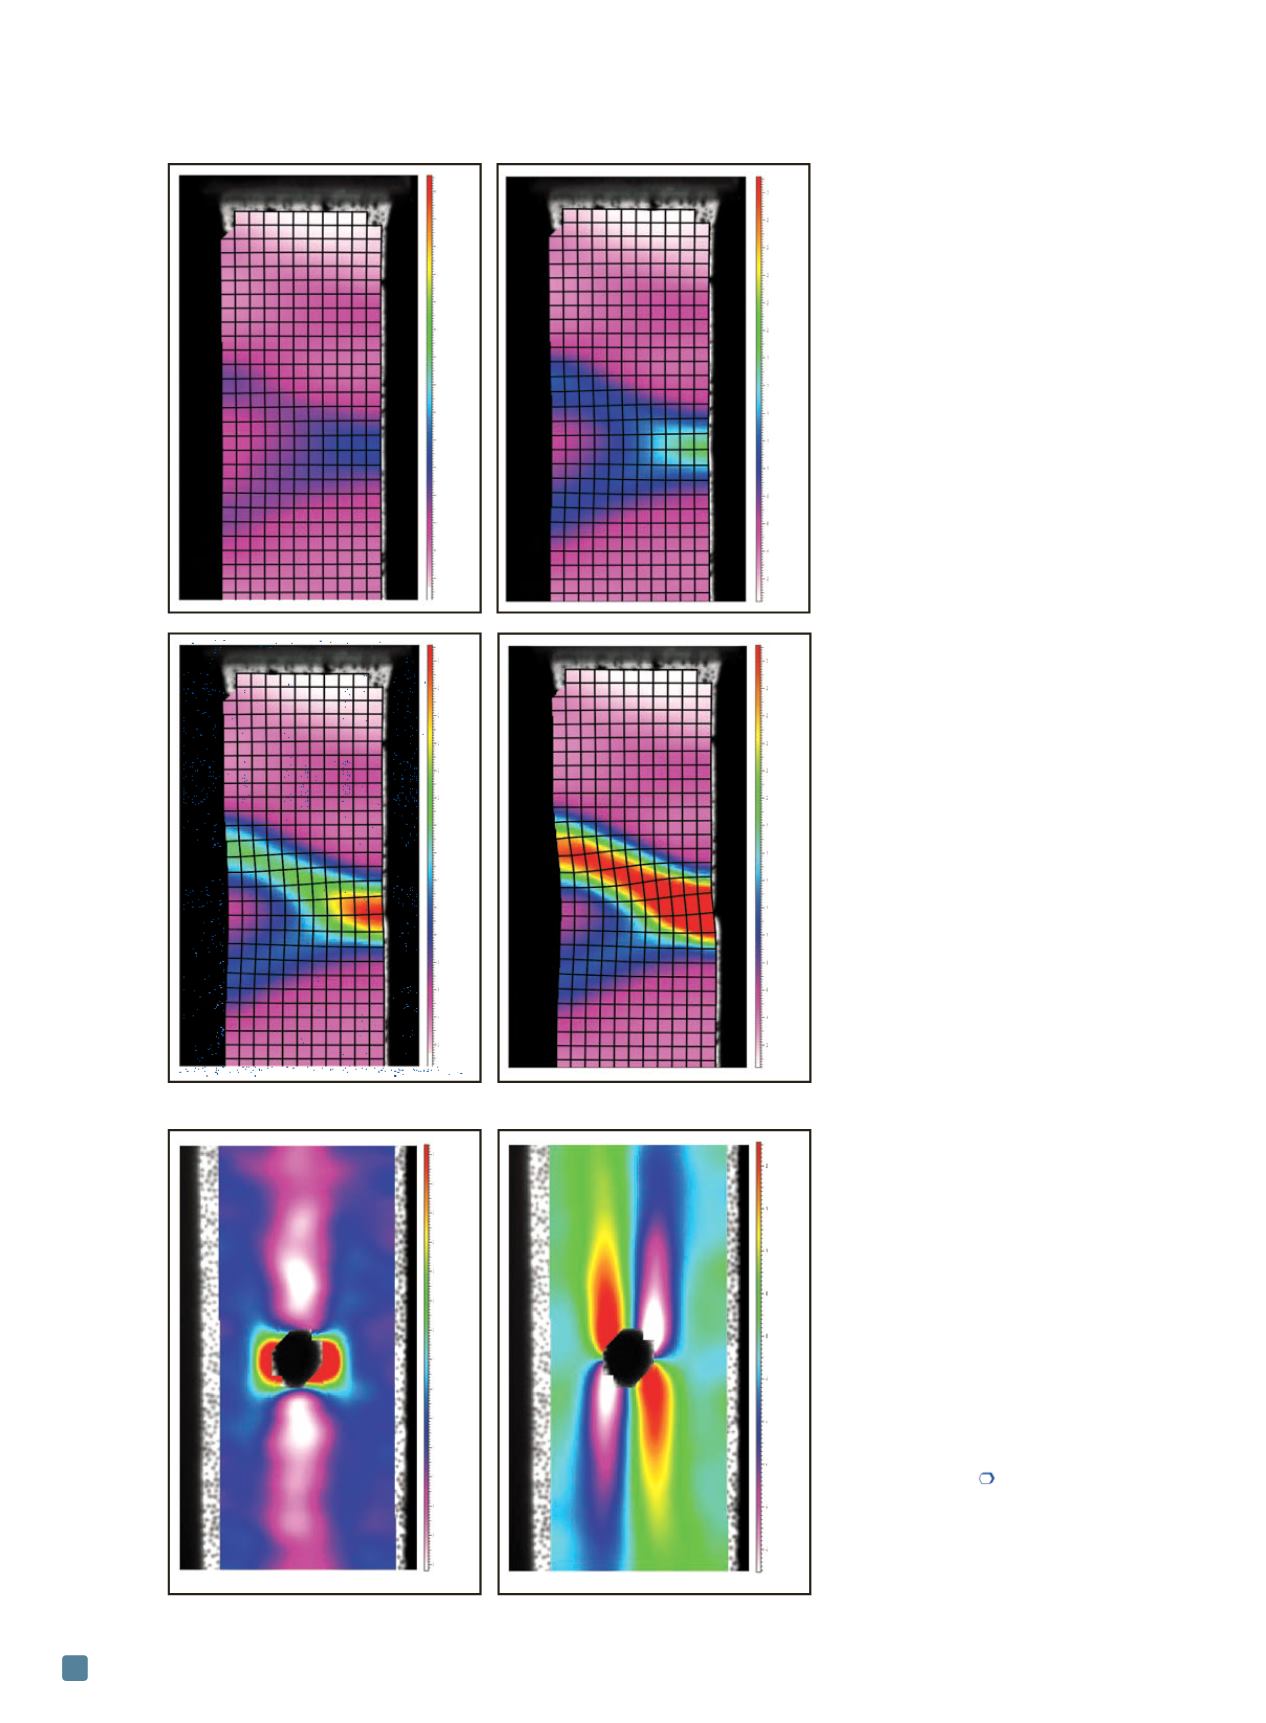
example in metals testing is where
strain can be seen as creating a “V”
shape across the specimen, ultimately
ending in a failure angled across the
sample, as shown in Fig. 4. It is very dif-
ficult to see this strain buildup without
a simulation, but DIC is measuring it
from real specimens.
Once a strain map has been created,
virtual extensometers and strain gauges
can be added at different locations along
the specimen to show how strain varies
when it is measured either close to or
away from the failure point. These results
add to the teaching value by offering an
easy-to-understand visual representation
of how failures actually occur.
In addition to teaching, DIC can be
used for test specimens and samples
with nonuniform strain distribution
throughout the material. In these cases,
single extensometers and gauges do not
provide much information about the
test piece deformation and strain. For
example, consider a tensile specimen
containing a through-hole. The hole
creates stress concentration, and there-
fore, produces a nonuniform strain pat-
tern. While it might seem obvious that
the strain is greater around the hole,
DIC shows how strain forms and also
allows measuring peak strain at the
point of material failure. As shown in
Fig. 5, axial strain builds to the left and
right of the hole, and is at a minimum
above and below the hole. With respect
to shear strain, the map shows a varying
positive-to-negative strain path around
the hole.
DIC is unlikely to replace tradi-
tional extensometers or strain gauges in
the short term, as these tools are re-
quired to meet current test standards.
However, it is also a requirement of re-
search departments and teaching uni-
versities to understand the complexities
of modern materials. Digital image cor-
relation is another tool to help accom-
plish this goal.
For more information:
Daniel Bailey is a
product manager for Instron, Coronation
Rd., High Wycombe, Bucks HP12 3SY, UK,
781.828.2500,
daniel_bailey@instron.com,
instron.com.
Fig. 4
—
DIC strain maps of a metal proceeding to failure.
Fig. 5
—
Axial (left) and shear (right) DIC strain maps for a through-hole specimen.
30
28
26
24
22
20
18
16
14
12
10
8
6
4
2
30
28
26
24
22
20
18
16
14
12
10
8
6
4
2
Maximum normal strain,
%
Maximum normal strain,
%
Maximum normal strain,
%
Maximum normal strain,
%
30
28
26
24
22
20
18
16
14
12
10
8
6
4
2
30
28
26
24
22
20
18
16
14
12
10
8
6
4
2
(a) (b)
(c) (d)
Axial strain,
e
yy
%
Shear strain,
e
yy
%
3.2
3
2.8
2.6
2.4
2.2
2
1.8
1.6
1.4
1.2
1
0.8
0.6
0.4
2
1.5
1
0.5
0
-0.5
-1
-1.5
-2
-2.5