


 19 / 50

ADVANCED MATERIALS & PROCESSES •
OCTOBER 2014
19
ulus initially decreased nearly linearly and then exhibited a
rapid drop beyond 573 K (300°C) due to the creep of grain
boundary phases. Because the target application for these
thermoelectric materials is waste heat recovery, detection
of the onset temperature of grain boundary sliding can help
determine the safe operating temperature range, which in
this case is up to 300°C.
Another example of applying RUS in materials re-
search is shown in Fig. 5, where Young’s modulus is
again measured as a function of temperature
[12]
. In con-
trast to seeing a downward trend as shown in Fig. 4b, an
upward trend is observed in the Young’s modulus of a
different PbTe-based thermoelectric material. The turn-
ing point around 523 K (250°C) in the curve indicates a
change in bonding strength. Further analysis confirms
the change is likely due to an order-disorder phase
transformation: This transformation is controlled by the
diffusion of doping elements such that when the heat-
ing/cooling rate is high, a hysteresis occurs (Fig. 5a),
while no hysteresis is observed when the heating/cool-
ing rate is reduced (Fig. 5b).
Resonant ultrasound spectroscopy
industrial applications
In contrast to research uses of RUS that mainly focus
on material property measurements, industrial applica-
tions primarily reside in nondestructive evaluation (NDE)
of precision components. The basic configuration of an in-
dustrial RUS unit is similar to its research counterpart, al-
though the sample stage and transducers may be modified
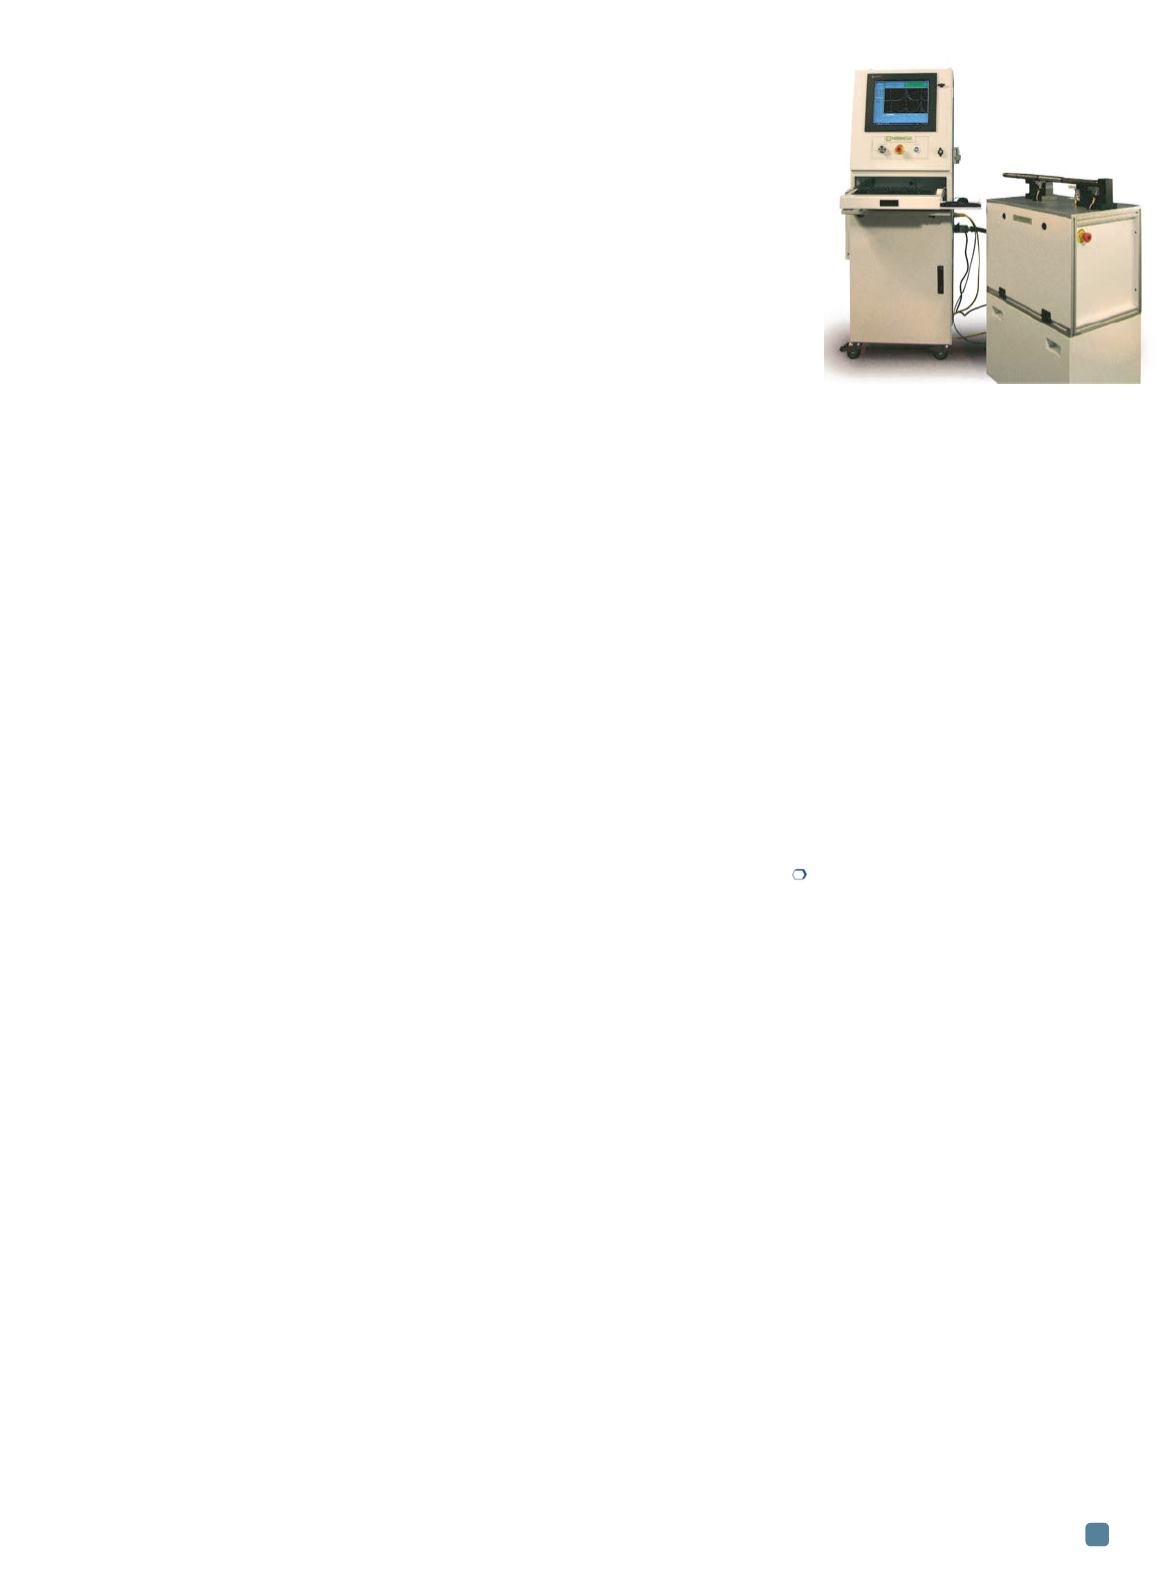
to accommodate larger and more complicated parts. Figure
6 shows an example of a commercial RUS unit with inte-
grated testing and online analysis capabilities.
A major difference between industrial and research ap-
plications involves data usage. Instead of calculating the
elastic constants, measured ultrasonic spectra (Fig. 2) are
directly used as input for analysis. Defects that result in
variations in vibrational modes (eigenfrequencies) will lead
to changes in RUS spectra. By comparing measured spec-
tra with standards, it can be determined whether a part
should be accepted or rejected, and potential defects in the
bad parts can be explored.
A general guideline for using RUS to evaluate the in-
tegrity of metallic and nonmetallic (i.e., ceramics and
composites) components is provided in ASTM standard
E2001-98
[13]
. According to this standard, a
fingerprint
—
usually a few characteristic resonant peaks—must first be
established. Then, sorting criteria for acceptance/rejec-
tion should be determined. In practice, establishment of
sorting criteria is often realized by examining a large
number of good and bad parts and analyzing the data in
a statistical manner. Typical criteria include the follow-
ing aspects in measured spectra:
peak shifts,
or changes in
peak positions;
peak splitting,
where a single peak splits
into two or more due to symmetry imperfection; and a
combination of peak shifts and splitting. Other consider-
ations include changes in peak amplitudes, peak broaden-
ing, and phase changes
[14]
.
Summary
Successful RUS applications
include identifying various
types of defects including
cracks (on the order of millime-
ters or submillimeters), cavi-
ties, geometrical imperfections,
compositional inhomogeneity,
and hardness variations
[13,14]
.
Compared to traditional NDE
methods, such as dye penetra-
tion, magnetic particle method, and
eddy current testing, RUS possesses
some unique advantages. One is the
ability to examine parts with both external and internal de-
fects, compared to dye penetration and magnetic particle
methods that can only be used to detect external defects.
Another is the ability of RUS to evaluate both conducting
and nonconducting components; in contrast, the eddy cur-
rent method does not work with nonconducting materi-
als. In addition, RUS measurements can be made very
quickly (on the order of minutes or less) if a good testing
procedure is developed.
Nevertheless, RUS has drawbacks. For example, it re-
quires special equipment and software, which are not yet
widely available. Further, establishing sorting criteria often
involves extensive efforts in terms of testing and data
analysis. Because it is an emerging technology, the learning
curve for adapting RUS to existing industrial facilities may
be steep. However, once these initial obstacles are cleared,
RUS will serve as a fast and reliable NDE technique in
many manufacturing settings.
For more information:
Fei Ren is an assistant professor, de-
partment of mechanical engineering, Temple University, 1801
N. Broad St., Philadelphia, PA 19122, 215.204.9593,
renfei@temple.edu.
References
1. D.B. Frasier and R.C. LeCraw,
Rev. Sci. Instrum.,
Vol 35,
p 1113, 1964.
2. H. Schreiber, et al.,
Science,
Vol 167, p 732, 1970.
3. A. Migliori, et al.,
Phys. Rev. B,
Vol 41, p 2098, 1990.
4. J. Maynard,
Phys. Today,
Vol 49, p 26, 1996.
5. Quatrosonics was renamed Quasar International in 2000,
and is now part of Illinois Tool Works’ Magnaflux Division,
see Ref. 6.
6. Quasar PCRI, Magnaflux, Albuquerque, NM.
7. Dynamic Resonance Systems Inc., Powell, WY.
8. A. Migliori, J.L. Sarrao, and W.M. Visscher,
Physica B,
Vol
183, p 1, 1993.
9. A. Migliori and J.L. Sarrao,
Resonant Ultrasound Spec-
troscopy,
Wiley-VCH, New York, 1997.
10. F. Ren, et al.,
Philos. Mag.,
Vol 89, p 1163, 2009.
11. F. Ren, et al.,
Mater. Res. Soc. Symp. Proc.
, Vol 1044, p 121,
2008.
12. F. Ren, et al.,
Acta Mater.
, Vol 58, p 31, 2010.
13. ASTM E 2001 – 98, Standard Guide for Resonant Ultra-
sound Spectroscopy for Defect Detection in Both Metallic and
Non-metallic Parts, ASTM, West Conshohocken, PA, 1999.
14. F. Willis, in
Proceedings of the Resonance Meeting,
Vol 1,
p 23, 2001.
Fig. 6
—
Commercial RUS unit.
Courtesy of Magnaflux.