


 23 / 50

ADVANCED MATERIALS & PROCESSES •
OCTOBER 2014
23
TECHNICAL SPOTLIGHT
Using
Digital Image Correlation
to Measure Full Field Strain
W
ith new and advanced materials
being developed continually, both
research efforts and materials test-
ing must adapt to keep up. Physical testing is
not simply a matter of following a standard to
collect data, but is a tool to analyze and opti-
mize properties. Traditional strain measure-
ment requirements involve characterizing
axial strain at one gauge length in the center of
the specimen. In some cases, transverse strain
is also measured to determine Poisson’s ratio,
and strain gauges are used where it is difficult
to use traditional extensometers.
However, existing strain measurement
techniques do not offer enough information
about how failures occur, so alternative meth-
ods are required. One technique involves
using digital image correlation (DIC) to
measure full field strain over the entire mate-
rial surface. In addition to the strain map pro-
duced, virtual strain gauges and extensometers
can be placed on the specimen after the test
and replayed multiple times. Further, the
technique can be used for almost any mate-
rial; polymers, metals, composites, rubbers,
foams, textiles, and other materials have been
tested using DIC.
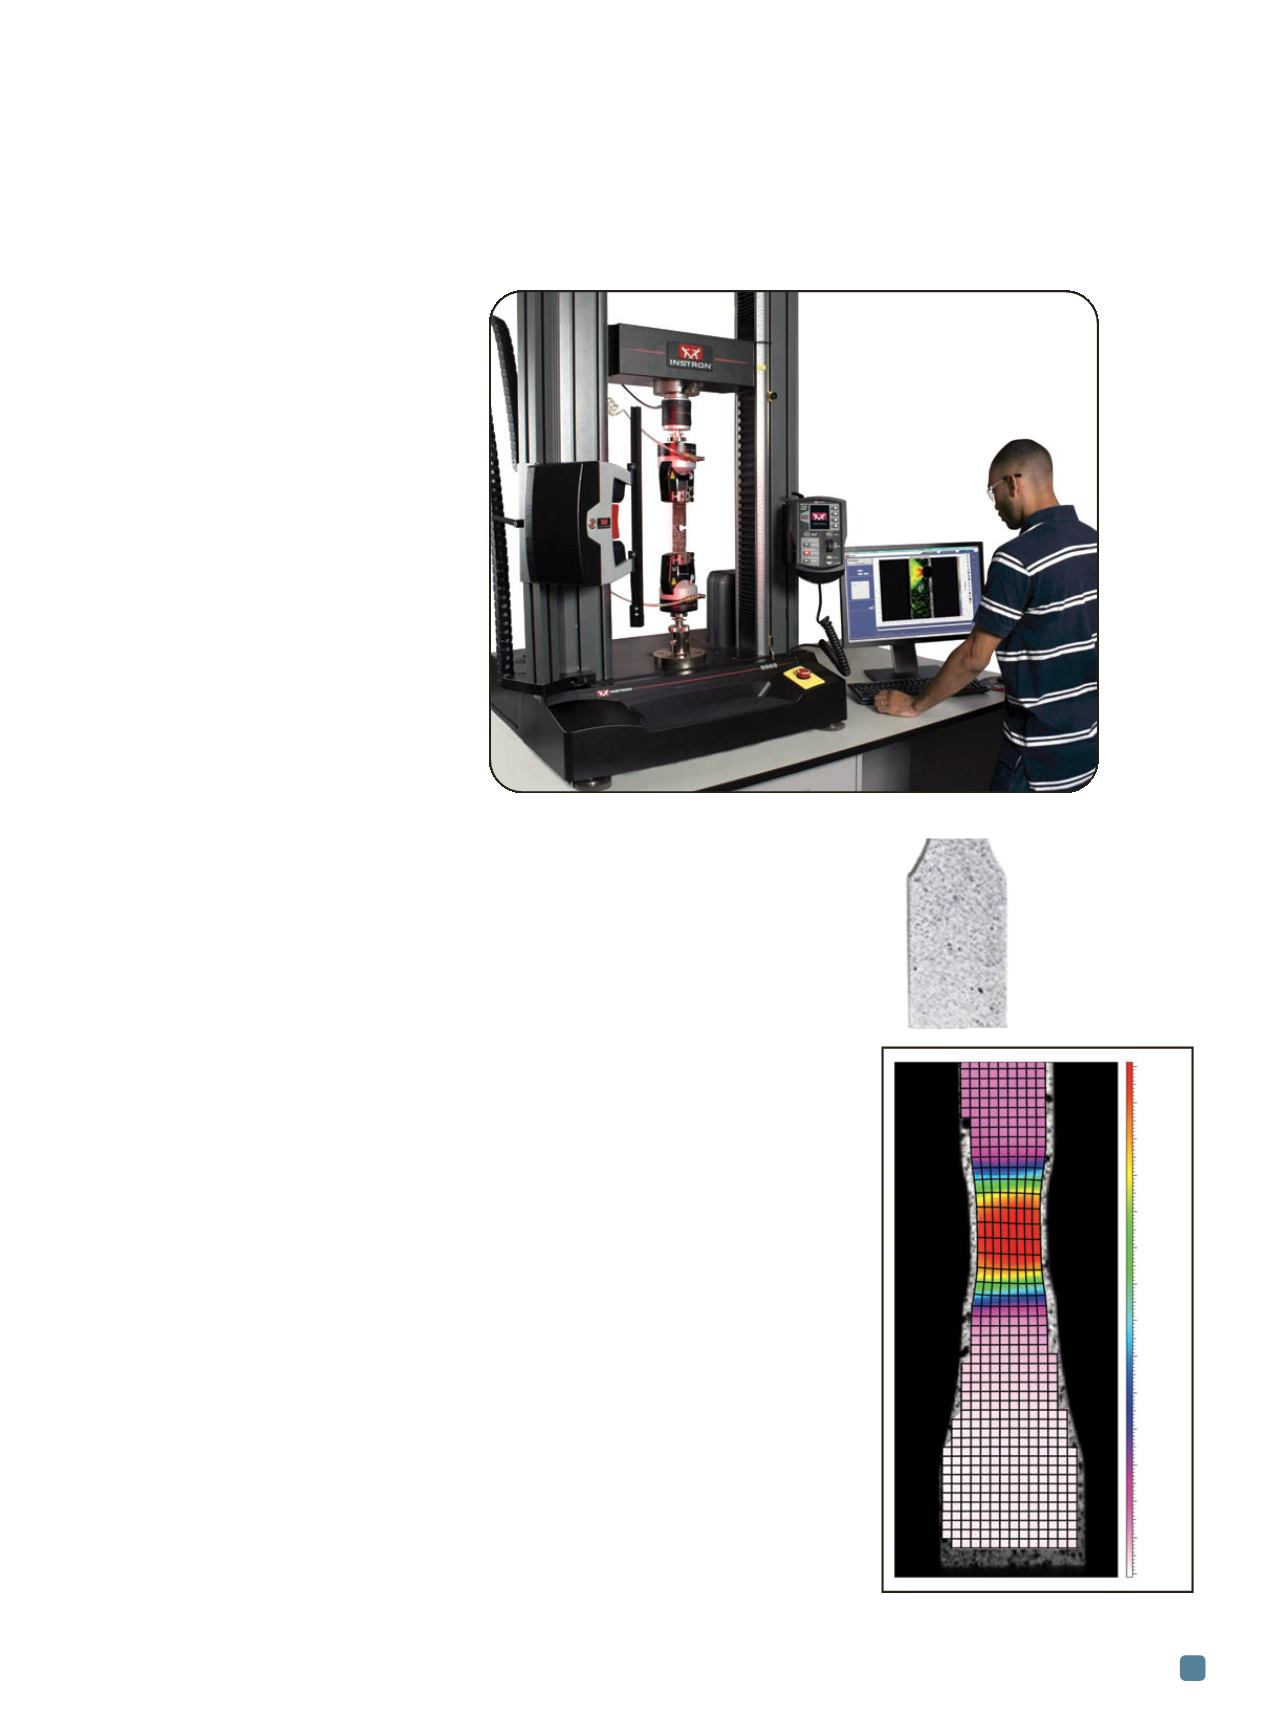
How digital image correlation works
Digital image correlation is a strain
measurement technique that works by cap-
turing a series of images throughout a test
and analyzing them afterwards. A typical
setup includes a camera system, lighting,
and software package to control image cap-
ture and conduct post-test analysis. Re-
cently, integrated DIC systems (Fig. 1),
which use existing video extensometers,
have been introduced to provide a stream-
lined package tailored to the materials test-
ing market.
Pre-test samples are usually treated with a
speckle pattern (Fig. 2) added by spraying,
stamping, or sticking decals to their surfaces.
In some cases, the sample’s natural surface pat-
tern is sufficient without the need to apply any
additional marking. The number of images
captured during a test depends on time, speed,
and the sample itself, but 50 to 100 images are
usually adequate. The first image—known as
the
reference image
—is captured when there is
no strain on the sample. The image is then split
into small subsets and the patterns within each
subset of subsequent images are compared to
the reference image, and displacements are
calculated from which a strain/displacement
map is produced. Only one sample is required
to determine axial and transverse strains and
displacements, shear strain, and maximum
and minimum normal strains.
These maps are similar to FEA-type im-
ages (Fig. 3), which leads to a very useful ap-
plication for DIC—proving whether or not
an FEA simulation is correct. In the past, en-
gineers used simple test data from exten-
someters and strain gauges to verify
predictions from an FEA simulation. With
the new technique, subtle changes in a ma-
terial that might be missed in a simulation
can now be physically measured and identi-
fied, allowing operators to compare what
they believe is happening to what is actually
happening.
DICsoftwarealsoallowstheinclusionofvir-
tual extensometers andstraingauges that canbe
placedanywhereonthesample.Thisenablesan-
alyzing the sample near failure points, so a posi-
tion does not have to be selected before
conductingthetest.Italsoenablescomparingex-
isting datawithnewresults.
DIC as a teaching tool and more
Having this type of visual method to
observe material failure in action, as well as
Fig. 2
—
Typical
speckle
pattern
applied
to a test
sample.
Fig. 3
—
Sample DIC strain map.
Fig. 1
—
Integrated digital image correlation (DIC) system.
70
65
60
55
50
45
40
35
30
25
20
15
10
5
0
Axial strain,
e
yy
%