


 26 / 50

other gap-type defect will virtually all be reflected to the
transducer and will produce a bright white pixel in the
acoustic image. Bright white features indicate gap-type de-
fects, whereas nongap features appear as shades of gray.
Gaps are often pseudocolored red to make them stand out.
No portion of the pulse crosses the defect (which has two
interfaces) to go deeper into the sample.
The process described here illustrates how planar
acoustic images are made. They usually display the internal
features of the whole area of a sample, which might be any-
thing from an electronics component to a medical pack-
age seal to a synthetic diamond cutting tool material. The
process for creating a nondestructive cross-section differs
chiefly in that the transducer does not scan the entire
x-y
area of the sample, but rather scans back and forth along
the single straight line that sets the location for the verti-
cal plane.
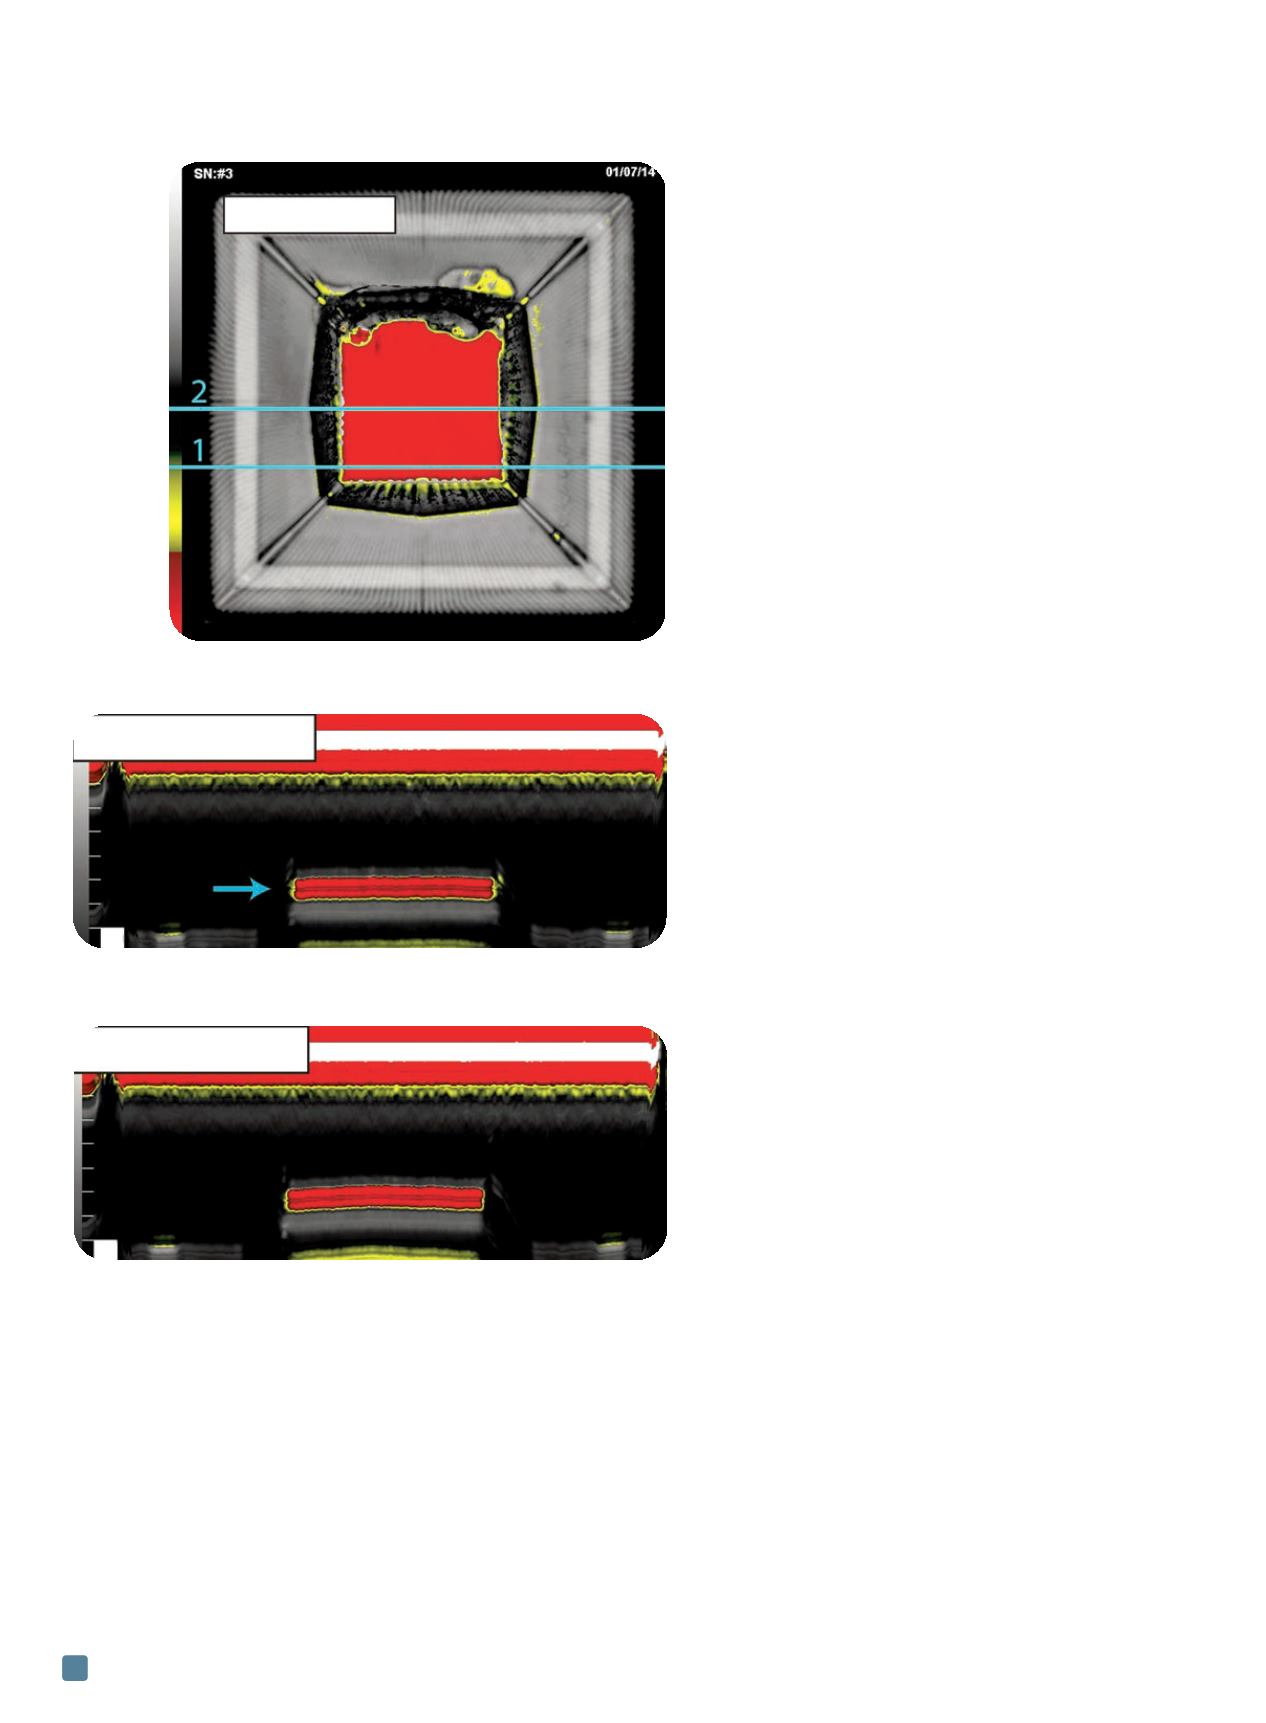
Integrated circuit case study
Figure 2 is a planar acoustic image of a plastic-encap-
sulated integrated circuit (IC). The fine lines radiating in all
directions are metal lead frame fingers while the four heav-
ier lines extending to each corner are tie bars. The red cen-
ter marks the location of the silicon die; red (highest
amplitude return echoes) indicates that the die is delami-
nated from the plastic encapsulation above it. The pale
gray square near the outer ends of the lead fingers is tape
that holds the lead fingers in place during IC package man-
ufacturing. To learn more about the delamination, and per-
haps to determine its cause, cross-sectional images were
made along a line intersecting the die near its lower edge,
and along a line at the center of the die.
The cross-sectional image made along the first line,
near the edge of the die, is shown in Fig. 3. The strong red
and white horizontal lines at the top indicate the interface
between the plastic (solid) and the water (liquid) at the top
surface of the IC package. Working downward from the
surface, there are no echoes and no material interfaces
until the horizontal red line (arrow) that marks the delam-
ination between the die face and the plastic above it. De-
lamination extends along the entire width of the die and
reflects >99.99% of the ultrasonic pulse.
Figure 4 is the cross-sectional view along the second
line at the center of the die. In this vertical slice, the red
delamination appears to be warped upward. But the red
line only images the interface between the mold compound
and the empty gap; ultrasound does not penetrate into the
gap. The gap probably formed when the curing mold com-
pound pulled away from the silicon and formed a shallow
bubble that is thickest above the center of the die.
While most samples imaged by this method are flat,
cylindrical samples can also be imaged by using a fixture
that rotates them. The straight line that defines the verti-
cal plane is drawn around the circumference of the cylin-
der at a given spot along its length. The transducer remains
stationary just above the sample, and scans the deepest
area of interest while the cylinder rotates through 360°. It
then scans the next deepest level until the surface of the
cylinder is reached.
Figure 5 shows the planar image (top) and cross-sec-
tional image (bottom) of a plastic tube that is bonded by a
polymer adhesive to a metal rod. In the planar image, the
red-black features are bubbles in the adhesive. As part of
the process modification, it was important to learn the
depth at which the bubbles lay.
To create the Q-BAM image, the transducer scanned
along the bottom edge of the planar image. The strong red
line at the top of the cross-sectional image represents the
interface between the plastic tube and the water couplant,
Figs. 3 and 4. There is very little difference in acoustic
ADVANCED MATERIALS & PROCESSES •
OCTOBER 2014
26
Planar view
Top side
15 MHz
Fig. 2 —
Planar acoustic image looking down into a plastic-
encapsulated integrated circuit. The two lines indicate the
locations for cross-sectioning.
Cross-section
10
Cross-section
10
Fig. 3 —
Acoustic cross-section along line 1. The horizontal red line in the
lower half of the image is the delamination that separates the die from the
plastic encapsulant above it.
Fig. 4 —
Sectioning along line 2 suggests that the delamination is thickest
over the center of the die.