


 25 / 50

P
hysical cross-sectioning is commonly used on
parts to reveal and study their internal features
and defects. An alternative technology produces
equivalent results and images for small parts without
damaging them. Although physical cross-sectioning of
parts is often standard practice, a newly developed
acoustic cross-sectioning method can be useful in cer-
tain cases.
Acoustic microscopes routinely provide aerial (top
view) planar acoustic images that offer nondestructive
views into parts. These planar images are widely used to
analyze part features and are an essential part of acousti-
cally guided destructive physical analysis (AGDPA), which
helps determine where physical sectioning should occur.
If a small part has failed in service, planar acoustic imaging
can pinpoint (in the
x-y
axes) the non-bond, delamination,
or void that is occurring during production and causing
the subsequent failure.
Q-BAM cross-sectioning method
A new method developed by Sonoscan Inc. called
Q-BAM cross-sectioning
goes a bit further. The part’s pla-
nar image is examined to determine a useful cross-sec-
tional view and a straight line is then drawn on the planar
image to define the desired cross-section. Ultrasound is
pulsed into the part by a scanning transducer and echoes
are returned. Acoustic images are made from these echoes.
In planar imaging, the transducer travels across the top
surface of the part, pulsing thousands of times and receiv-
ing thousands of echoes per second. At the part’s edge, the
transducer moves fractionally along the length of the part,
and scans back across its width.
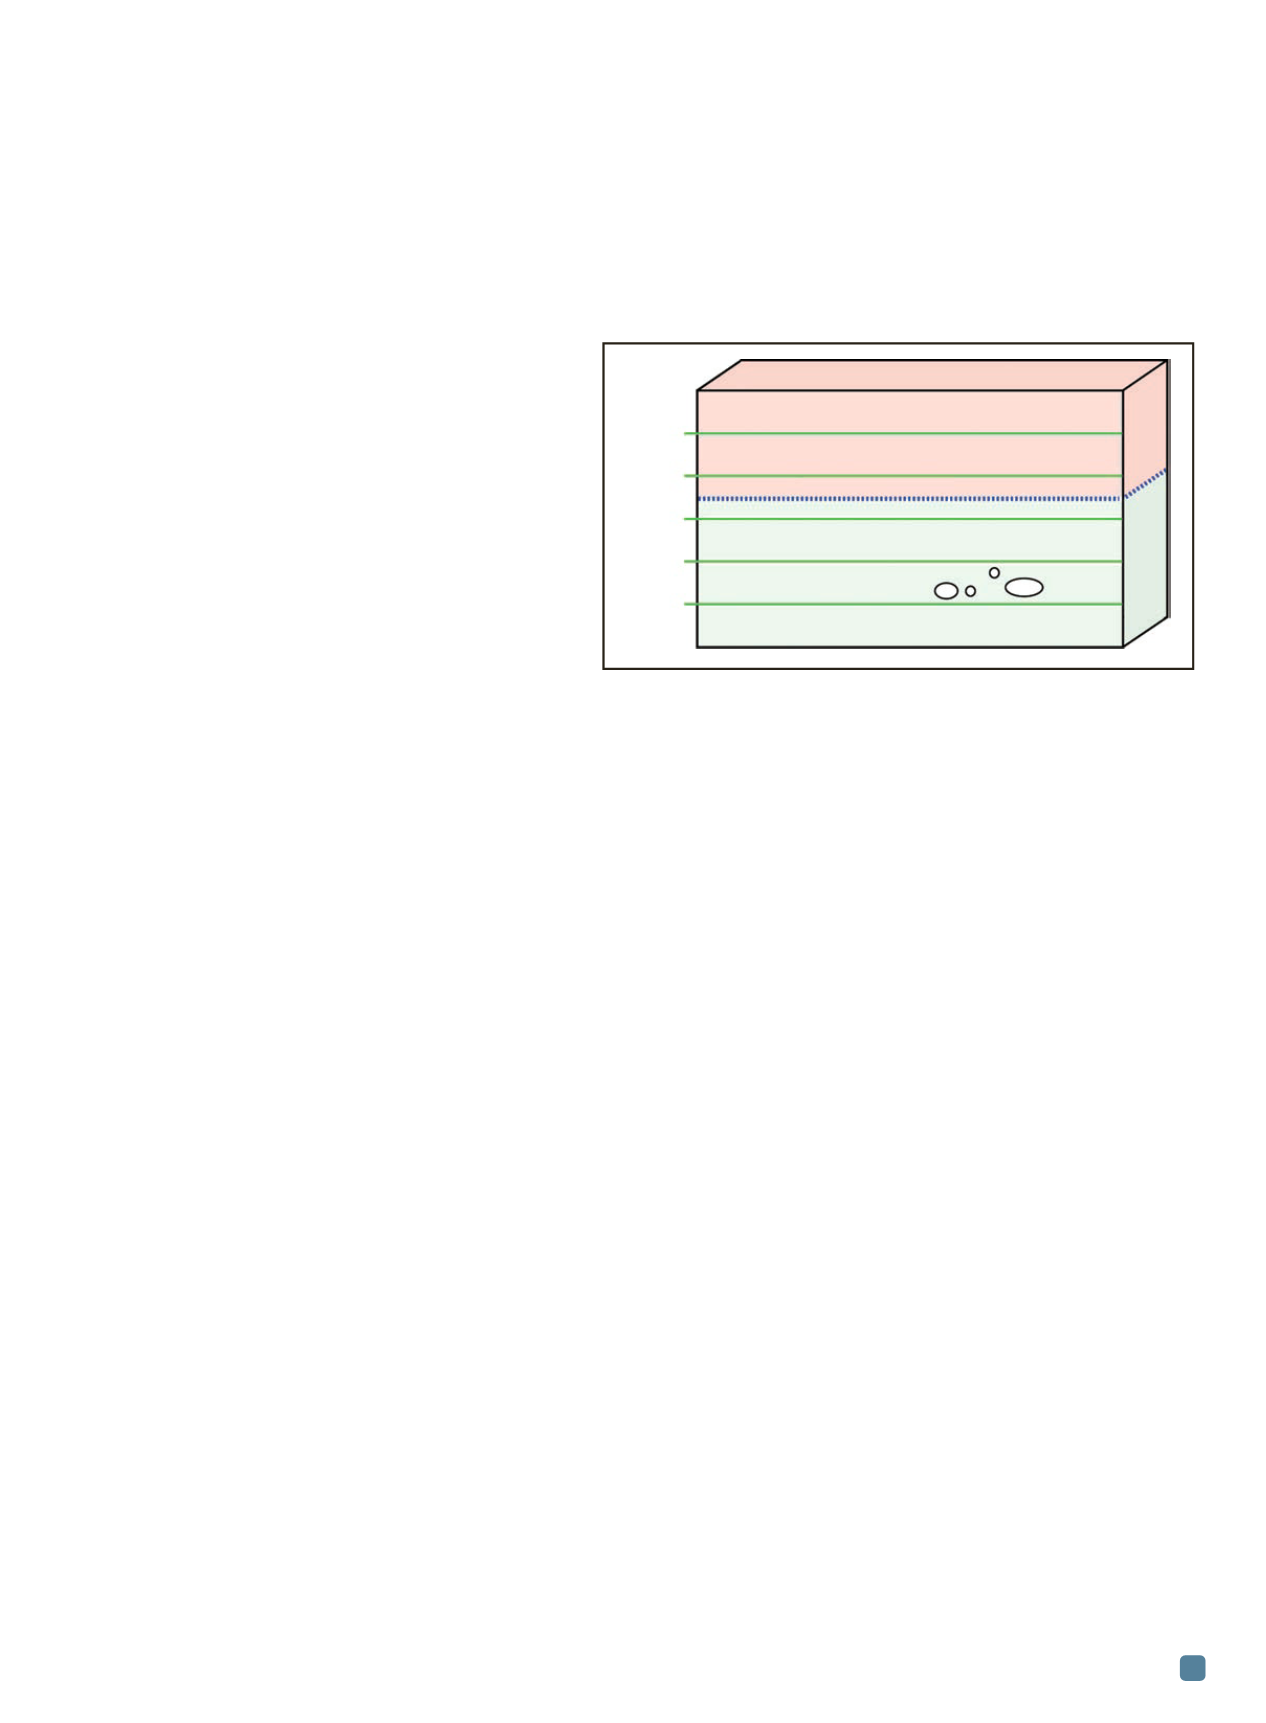
In Q-BAM imaging, the transducer scans only the sin-
gle straight line defined by the operator. On the first pass,
it collects echoes from the deepest level of the part, Depth
1 in Fig. 1. This depth might be from 1.0 to 1.2 mm below
the top surface of the part. The ultrasonic beam is focused
on this depth during this scan. Ultrasound is also pulsed
into the entire thickness of the part, but on this first scan,
only the echoes (if any) from this single depth are collected
and recorded.
Next, the ultrasonic beam focuses on a 0.8 to 1.0 mm
depth, Depth 2 in Fig. 1, and the echoes are recorded. The
cross-sectional image displays the voids present at this
depth
and
that intersect the vertical plane defined by the
line. The process continues until all depths have been
scanned along the chosen line. In Depth 4, the cross-sec-
tional image displays a horizontal line of some shade of
gray, illustrating the material interface. The operator se-
lects how many depths will be scanned, which can range
from just a few to 100 or more.
Scanning part thicknesses
Some parts can be effectively cross-sectioned using
a B-Scan imaging mode, where the entire thickness of
the part is encompassed in a single scan. B-Scan works
best when the beam is focused on a single depth of in-
terest, whereas the Q-BAM image is focused on the en-
tire part depth.
Nondestructive sectioning is performed by C-SAM
acoustic microscopes and is just one of the microscope’s
many imaging modes. The tool employs a laterally scan-
ning transducer that pulses ultrasound into the surface of
the sample as it scans. The frequency of the ultrasound is
typically between 15 and 230 MHz. The transducer, which
may be moving laterally at a speed in excess of 1 m/s, sends
a pulse of ultrasound into the sample and receives the re-
turn echoes thousands of times per second.
Ultrasound travels through materials such as ceram-
ics, polymers, and metals at thousands of meters per sec-
ond, enabling the transducer to collect a lot of data quickly.
Return echoes only come from material interfaces. If the
sample is a single homogeneous material without internal
defects, no echoes will come from the bulk of the material,
and the acoustic image will be entirely black. In contrast,
a very strong echo will occur from the top surface of the
part where it interfaces with the water that couples it to
the transducer.
As another example, the material interface between a
polymer and a metal will send back an echo with some sort
of mid-range amplitude—the interface between these two
solids will return 50% or another portion of the ultrasonic
pulse. The percentage of the pulse reflected can be calcu-
lated from the density and speed of sound of the two ma-
terials, but it is never close to 100%. That degree of
reflection (>99.99%) is reserved for solid-to-gap interfaces.
An ultrasonic pulse striking a crack or delamination or
ADVANCED MATERIALS & PROCESSES •
OCTOBER 2014
25
Nondestructive Acoustic
Cross-Sectioning
Helps Pinpoint
Part Failures
TECHNICAL SPOTLIGHT
Fig. 1 —
Various sample depths are scanned by the transducer, starting at
the bottom.
Depth 6
Depth 5
Depth 4
Depth 3
Depth 2
Depth 1
Material interface
Voids