


 17 / 50

ADVANCED MATERIALS & PROCESSES •
OCTOBER 2014
17
Resonant Ultrasound Spectroscopy
Offers Unique Advantages as a
Nondestructive Test Method
R
esonant ultrasound spectroscopy
(RUS) is an emerging ultrasonic meas-
urement technique. By measuring the
natural vibrational frequencies of test samples,
RUS can determine the full set of elastic con-
stants. For example, RUS can obtain Young’s
modulus, shear modulus, and Poisson’s ratio
for isotropic materials. By comparing the vi-
brational spectra of a test sample to those ob-
tained from a standard, it is possible to infer
the causes of the differences (if any) and de-
tect various part defects, such as size varia-
tions, cracks, and pores.
RUS first appeared in the second half of
the 20th century with its development fueled
by advances in computing power. In 1964,
Frasier and LeCraw performed one of the ear-
liest RUS measurements on spheres of
isotropic materials
[1]
. After this initial success,
much improvement was made in the geo-
physics community, where RUS was used by
Anderson and coworkers to measure the elas-
tic properties of spherical lunar samples in the
1970s
[2]
. After the late 1980s, RUS was adapted
by some physicists and materials scientists in-
cluding Migliori and coworkers, who began to
examine high-temperature superconducting
materials
[3]
. Current research uses of RUS in-
clude a wide range of topics in physics, geo-
physics, and materials science, where elastic
constants are being accurately measured on
samples as small as 70 µg
[4]
.
Industrial applications of RUS appeared
around the beginning of the new millennium,
used for quality control of manufactured parts.
Among the first commercial RUS units in the
U.S. were those made by Quatrosonics
[5]
in the
1990s based on technology developed at Los
Alamos National Laboratory. However, due to
the hardware and software complexity, com-
mercial RUS units are still only available from a
few sources
[6,7]
.
RUS is attractive because measurements are
fast and nondestructive, and can also be auto-
mated. But data interpretation could be chal-
lenging due to the complicated nature of the
theories. Thanks to advances in computer sci-
ence and technology, codes and software are
now available for data reduction and analysis,
as well as interpretation.
Resonant ultrasound spectroscopy
fundamentals
All RUS-related applications start with
measuring the vibrational response of test sam-
ples when subjected to mechanical stimulation.
For a piece of solid material, the natural me-
chanical vibrational frequencies (i.e., eigenfre-
quencies), which correspond to specific
vibrational modes such as bending and torsion,
are solely determined by the material’s mass
density, geometric parameters, and elastic con-
stants. Because mass density and geometric
factors are easy to obtain, if one could measure
the natural vibrational frequencies of a test
sample, its elastic constants could be back cal-
culated—an inverse mathematical problem. In
practice, due to the constraints of computing
power, some simple geometry (such as spheres,
cubes, and prismatic bars) is often used in ac-
tual measurements.
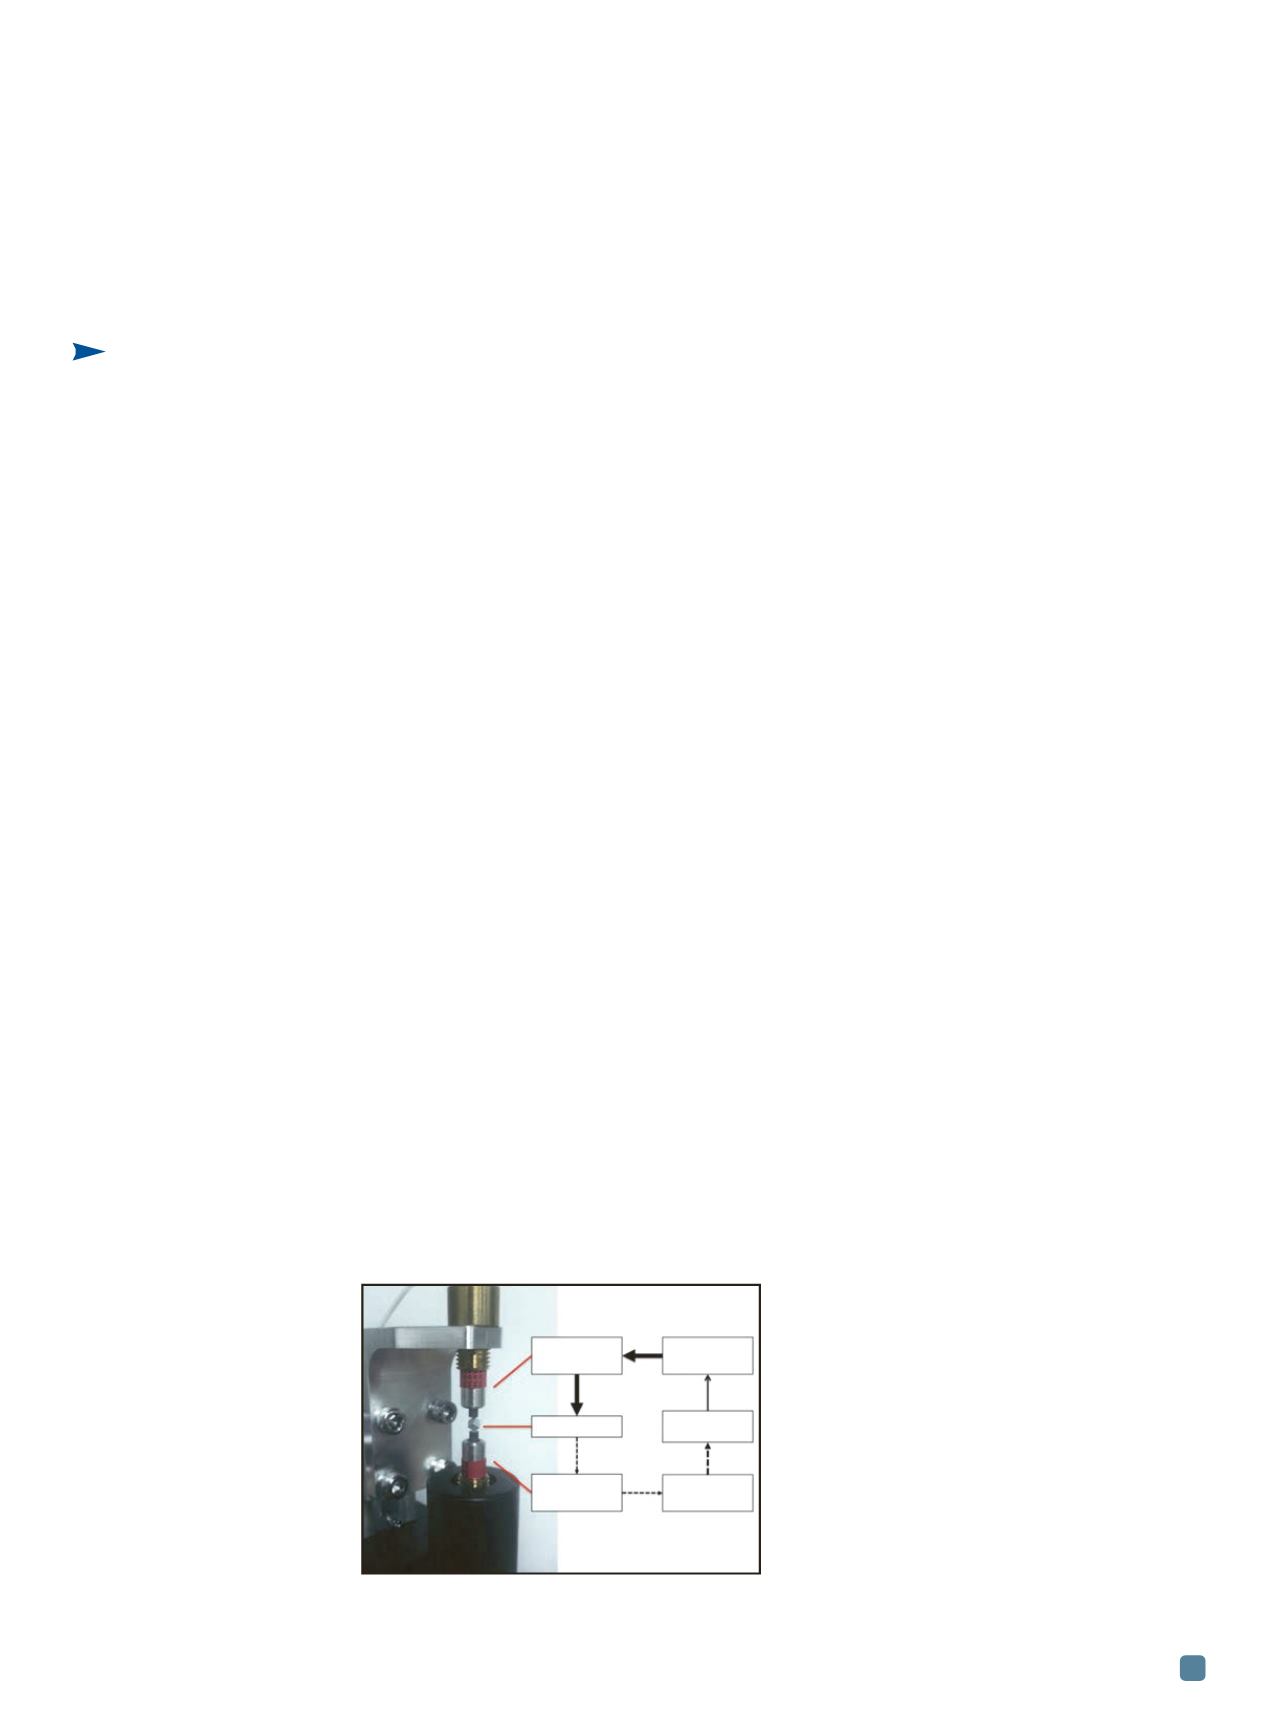
An example of measuring a cube sample
using a two-probe RUS is shown in Fig. 1. The
sample, approximately 2 mm wide on each
side, is sandwiched between two piezoelectric
transducers. One of the transducers (the
driver transducer) is used to apply mechanical
stimulation provided by a signal generator to
the test sample; the other transducer (the
pickup transducer)
listens
to the response
from the sample and feeds it back to the data
acquisition module. Input signals are usually
a series of mechanical waves with a wide band
of frequencies in the ultrasonic range (a few
hundred kHz to MHz). Only those waves with
frequencies matching the natural vibrational
frequencies of the test sample can be detected
by the pickup transducer. The resulting spec-
Haoqi Li
Fei Ren*
Temple University
Philadelphia
Resonant
ultrasound
spectroscopy
is making
headway as a
fast and
nondestructive
measurement
technique.
Thanks to
advances in
computer
technology,
codes and
software are
now available
for data
reduction,
analysis, and
interpretation.
*Member of
ASM International
Fig. 1
—
Typical resonant ultrasound spectroscopy
(RUS) measurement in a two-transducer setup.
Driver
transducer
Sample
Pickup
transducer
Signal
generator
Computer
Amplifier