


 18 / 62

A D V A N C E D M A T E R I A L S & P R O C E S S E S | F E B R U A R Y 2 0 1 6
1 8
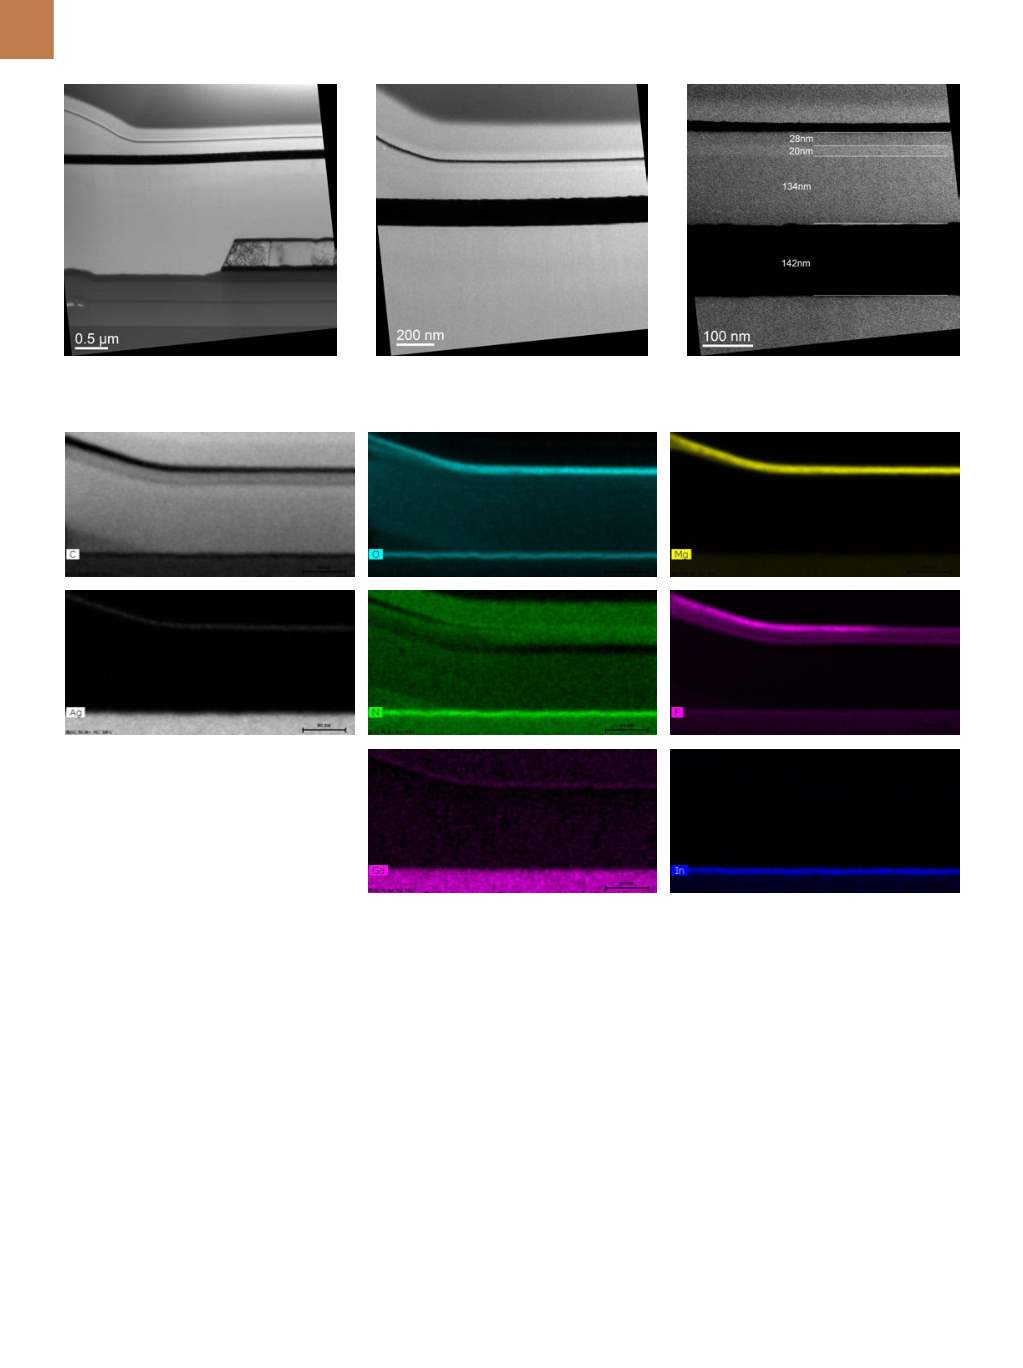
Fig. 4 —
TEM images: (a) Bright field overview of blue pixel cross section; (b) higher magnification bright field image of OLED stack;
(c) measurements of layer thicknesses frombright field image.
Fig. 5 —
STEM EDS element distribution
maps for selected elements (normalized
raw intensity plots). Note layer separation
in C and Nmaps; O enrichment at metal
surfaces; F enrichment in the topmetal, ETL
layer, ETL/EML interface, and at bottom
electrode surface (in layer on top surface of
bottommetal).
One of Fraunhofer CAM’s most sig-
nificant recent acquisitions is the Titan
G2 60-300 S/TEM from FEI. This system
provides the widest commercially avail-
able range of beam energies, maximiz-
ing penetration of heavier samples at
higher energies while improving con-
trast in lighter samples and reducing
knock-on damage in beam-sensitive
samples at lower energies.
AMOLED TOUCHSCREEN
APPLICATION
Touchscreen displays have become
ubiquitous on mobile phones, tablets,
and laptop computers. Typically they
are created by integrating a capacitive
sensor array with an active matrix or-
ganic light emitting diode (AMOLED)
array. Manufacturers use various names
for their proprietary technologies. Sam-
sung, for instance, calls their technology
Super AMOLED. Recently, a touchscreen
manufacturer asked Fraunhofer CAM
whether it was possible to image the
structure and analyze the composition
of a touchscreen AMOLED stack. For the
purpose of the demonstration, a com-
mercially available Samsung Galaxy III
mobile phone was purchased. No infor-
mation from the manufacturer was so-
licited or used in the investigation.
The display consists of a pattern
of red, green, and blue (RGB) diodes.
Each diode consists of multiple layers of
material with thicknesses ranging up to a
few tens of nanometers. Layer thickness
and composition determines the color
and efficiency of the diode. The blue di-
ode is themost sensitive toprocess varia-
tions, aging, and is also the most difficult
to produce. The planned analysis work-
flow involved the following steps:
1. Separate the Super AMOLED display
from the smartphone.
2. Prepare TEM cross sections by FIB,
including low-voltage polishing and
transfer into a special TEM clip holder.
3. PerformTEM investigations at 80 kV.
Visualize andmeasure the different
active layers (thickness and structure).
4. Analyze the elemental distribution
within the layers.
(a)
(b)
(c)