


 27 / 102

A D V A N C E D
M A T E R I A L S
&
P R O C E S S E S |
O C T O B E R
2 0 1 5
2 7
in this deposit layer actually increases
resistance to further corrosion, hinder-
ing its own progress. However, it can-
not be completely stopped due to the
porosity of Mg(OH)
2
and the growth
continues deeper into the metals.
In order to determine electric
current distribution and analyze the
chemical response, the non-constant
growth and influencing material prop-
erties must be accounted for. Using
the
Chemical Reaction Engineering
and Batteries & Fuel Cells
modules in
the simulation software, the rivet and
sheet metal are treated like a set of
electrodes. This allows assessment of
the anode/cathode area ratio, elec-
trolyte exposure duration, and chang-
es in electric current due to Mg(OH)
2
buildup, which contributes to the mag-
nesium degradation.
Because porosity directly affects
barrier properties, the resulting sur-
face topology is influenced by the
downward degradation velocity and
the opposing growth of the deposit.
Basic galvanic current density compu-
tations were modified by these layer
growth aspects. This led to the study of
time-dependent variations in the elec-
trochemical response of the electrodes.
The model includes chemical
reaction rates, known electrochem-
ical properties of the metals, and a
time-dependent function with an expo-
sure period of 24 hours. Results report
the electric potential and current densi-
ty when the rivet joint is exposed to the
electrolyte, and reveal surface coverage
(proportion of sheets and rivet surfaces
covered by Mg(OH)
2
) at different times
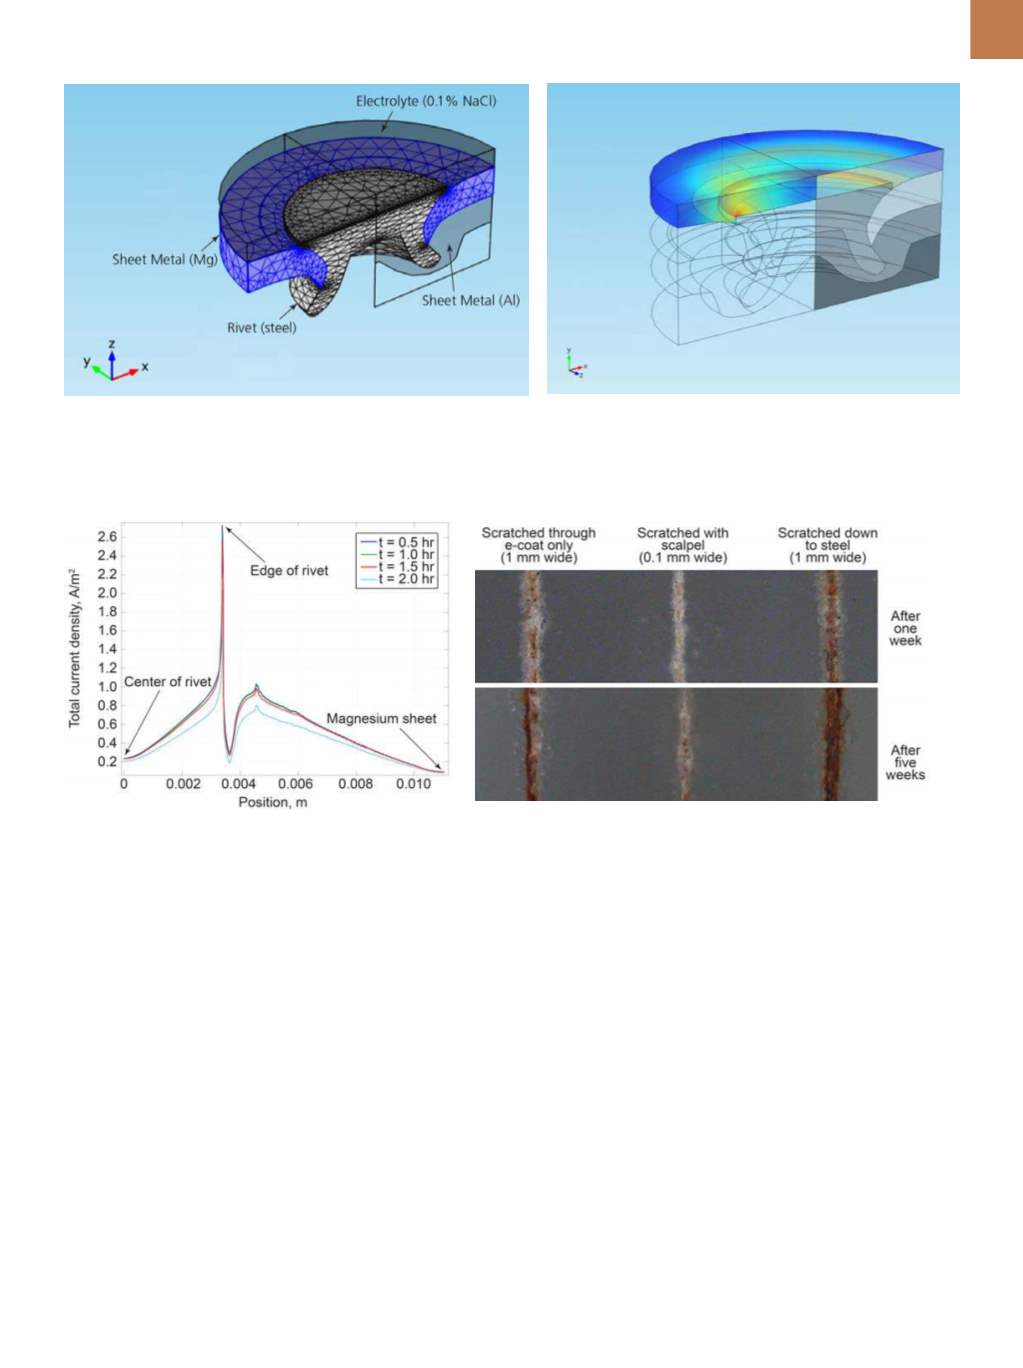
after immersion. Current density varies
over distance from the center of the riv-
et, showing where corrosion will occur
most rapidly (Fig. 3).
DELAMINATION RISKS
In addition to galvanic corrosion
at the rivet-sheet interface, automotive
Fig. 2 —
Geometry depicting half of a punch rivet joint in COMSOL Multiphysics software (left). Simulation results show current density at the sur-
face of the rivet and sheet metal. The simulation mathematically models current flow at the rivet-sheet interface; the highest current density occurs
at the sharp edge (right).
Fig. 3 —
Simulation software plot showing localized current
density at different positions on the rivet joint’s surface.
Fig. 4 —
Corrosion test on a galvanized steel sheet showing visible corrosion
in the scratched layers (view from above). Several initial scratches of varying
depths and widths were created in order to analyze the influence of scratch size
on the delamination process. Results are shown after one week (top) and five
weeks (bottom).