


 21 / 50

A D V A N C E D
M A T E R I A L S
&
P R O C E S S E S |
A P R I L
2 0 1 7
2 1
selection. An example of a PUGH matrix
is shown in Fig. 5.
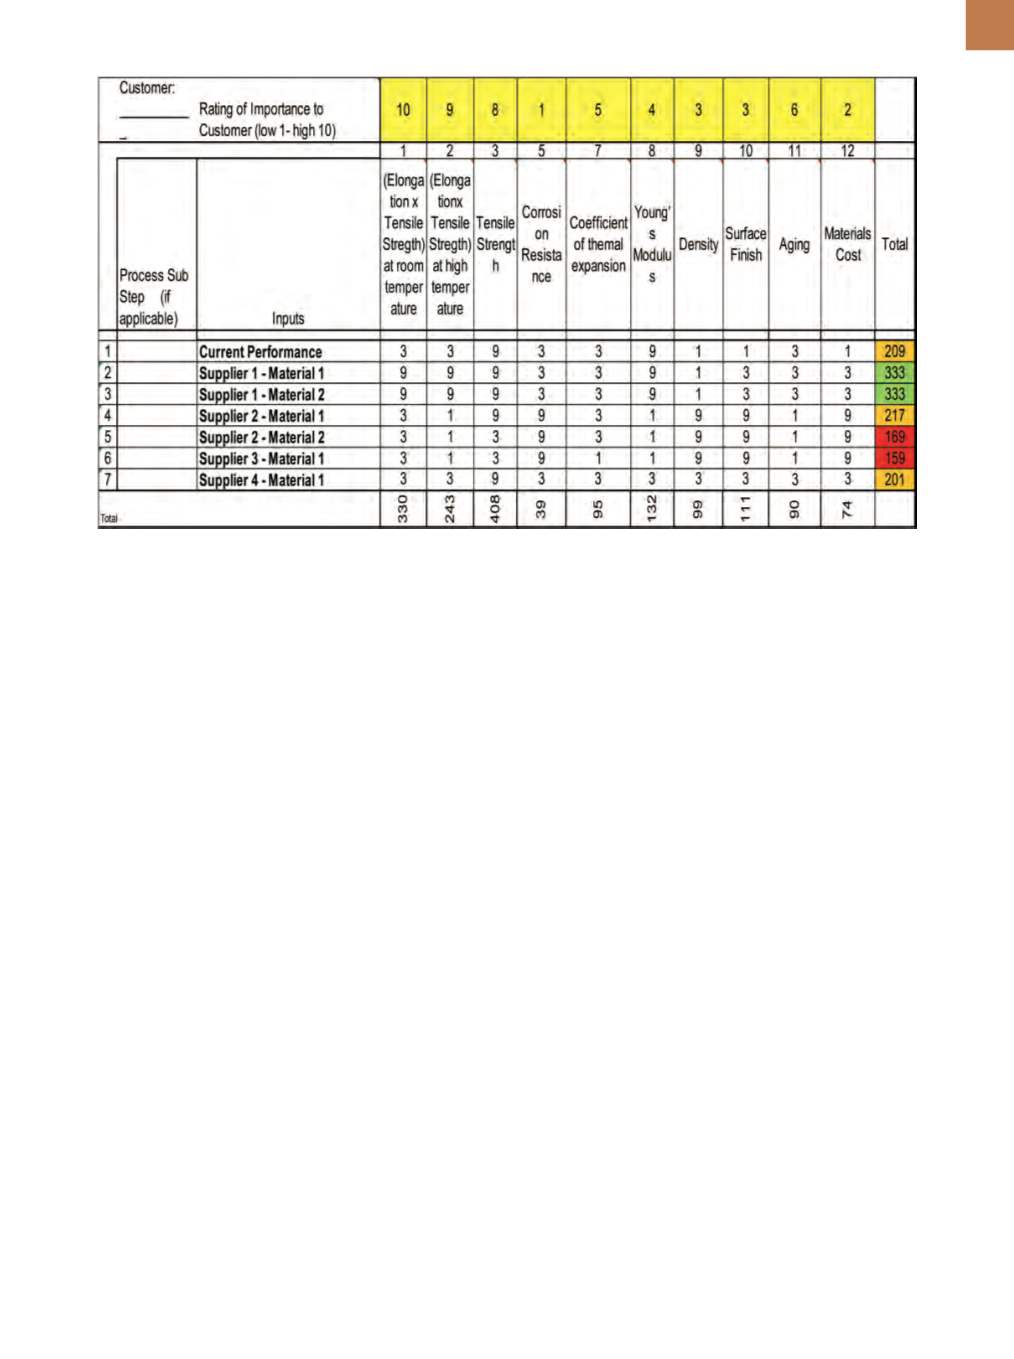
Cause & Effects (C&E) concept selec
tion
. The C&E matrix
[7]
is also construct-
ed using the data and information from
the supplier and in-house testing. Key
process inputs are used to create an
importance rating. Scoring is based on
materials properties evaluation. The re-
sulting concept selection matrix for cur-
rent performance compared with new
materials is given by the C&E matrix.
The criteria for each material choice
are rated on a scale of 1 to 10 based on
importance to the customer. Each ma-
terial concept is rated using 0, 1, 3, and
9, with 9 showing a strong correlation.
The matrix displays total scoring for
each material concept based on which
selection can be made.
At this point, concept selection
can be narrowed down based on rank-
ings and ratings from PUGH and C&E
matrices. An example of a C&E matrix is
shown in Fig. 6.
SUMMARY
Using a six sigma, statistics-based
approach for selecting materials of-
fers a unique way to compare different
options for use in various applications.
The materials selection template is
used to identify the optimal process and
supplier. The statistical tools are fairly
easy to use and provide a clear picture
of how to capture the correct voices
within a business to create the key re-
quirements a material must meet. CPT
and QFD tools lay out critical-to-quality
measures translated as material prop-
erties linked to key requirements. QFD
provides the first point of differenti-
ation between materials, and bench-
marks current performance and current
requirements. PUGH and C&E matrices
evaluate material choices and define
clear ranking between materials. At this
point, materials can be selected based
on the final ranking defined by PUGH
and C&E. Thematerial selection process
template also identifies critical points
where these statistical tools should be
used. This type of selection process is
both quick and effective.
~AM&P
For more information:
Karteek Ke-
savamatham is principal product
engineer−materials, ZF TRW, 34605
Twelve Mile Rd., Farmington Hills, MI
48331, 248.699.4592,
karteek.kesav- amatham@trw.com.
References
1. M.F. Ashby andK. Johnson,
Materials
and Design, the Art and Science of
Materials Selection in Product Design
,
Butterworth-Heinemann Ed., Oxford,
UK, 2002.
2. K.G. Swift and J.D. Booker,
Manu
facturing Process Selection Handbook
,
Butterworth-Heinemann Ed., Oxford,
UK, 2013.
3. T. Pyzdek and P. Keller,
The Six Sigma
Handbook
, McGraw-Hill, 3rd Ed., 2010.
4. G.L. Duffy and J.W. Moran,
Quality
Function Deployment
, Am. Soc. for
Quality, 2010,
http://asq.org/quality- press/display-item=E1382.5. Critical to Quality – CTQ
, iSixSigma,
http://www.isixsigma.com/dictionary/ critical-to-quality-ctq/.
6. PUGH Decision Matrix
, Am. Soc. for
Quality,
http://asq.org/learn-about- qua l i t y /de c i s i on -mak i ng - t oo l s / overview/decision matrix.7. R. Pereira, Cause & Effect Matrix,
Gemba Academy, 2007, <blog.gemba
academy.com/2007/06/11/need-help-
making-decisions/>.
Fig. 6 −
C&E concept selection matrix.