


 21 / 78

or pin connections were used for high-speed testing. Impact
load was measured at the reaction point during the impact
event using a strain gauge-type load cell attached below the
rigid table structure. The load cell was connected to the
welded coupon through the upper sample holder. The mov-
ing head was dropped from a free-fall height of 2.59 m
(8.5 ft). The moving mass contacted an impact bar extend-
ing through the structure and connected to the lower sam-
ple holder. Load was transmitted directly to the bottom
attachment point of the test coupon. Sample displacement
was measured using a linear voltage displacement trans-
ducer (LVDT) placed between sample attachment points.
T-section sample testing
Longitudinal and transverse loading were applied dur-
ing T-section sample testing, as illustrated in Fig. 2. T-section
static testing was conducted with an electromechanical
test system and a fixture was designed to rigidly secure
the T-section sample during testing. The fixture includes
a 45 × 45-mm backing bar inside the long beam to bolt
the sample to the fixture base through the holes in the
cover plate (Fig. 2).
High-speed testing was conducted using an MTS drop
tower, instrumented with an LVDT and load cells. The
same rigid test fixture used for the static tests was used in
the high-speed testing. Figure 9 shows broken T-samples
for transverse and longitudinal loading. For transverse
loading, spot welds were broken at the cover plate joined
to the long beam. For longitudinal loading, spot welds were
broken at the long beam to short beam intersection. FEA
was conducted using the failure parameters developed
from the small samples to predict spot weld failure and val-
idate the final failure parameters.
Summary
A test method was developed to create spot weld
failure parameters (joint strength at axial, shear, tor-
sional, and combined loading) for crash simulation
during automotive structure design. The method in-
cludes testing small samples and T-section samples.
Small samples consisting of KSII, lap-shear, coach-
peel, and torsional configurations were designed to
evaluate the axial, shear, and bending strength of spot
welds, as well as the strength during combined axial,
shear, and bending loads. T-section samples were de-
ADVANCED MATERIALS & PROCESSES •
NOVEMBER-DECEMBER 2014
21
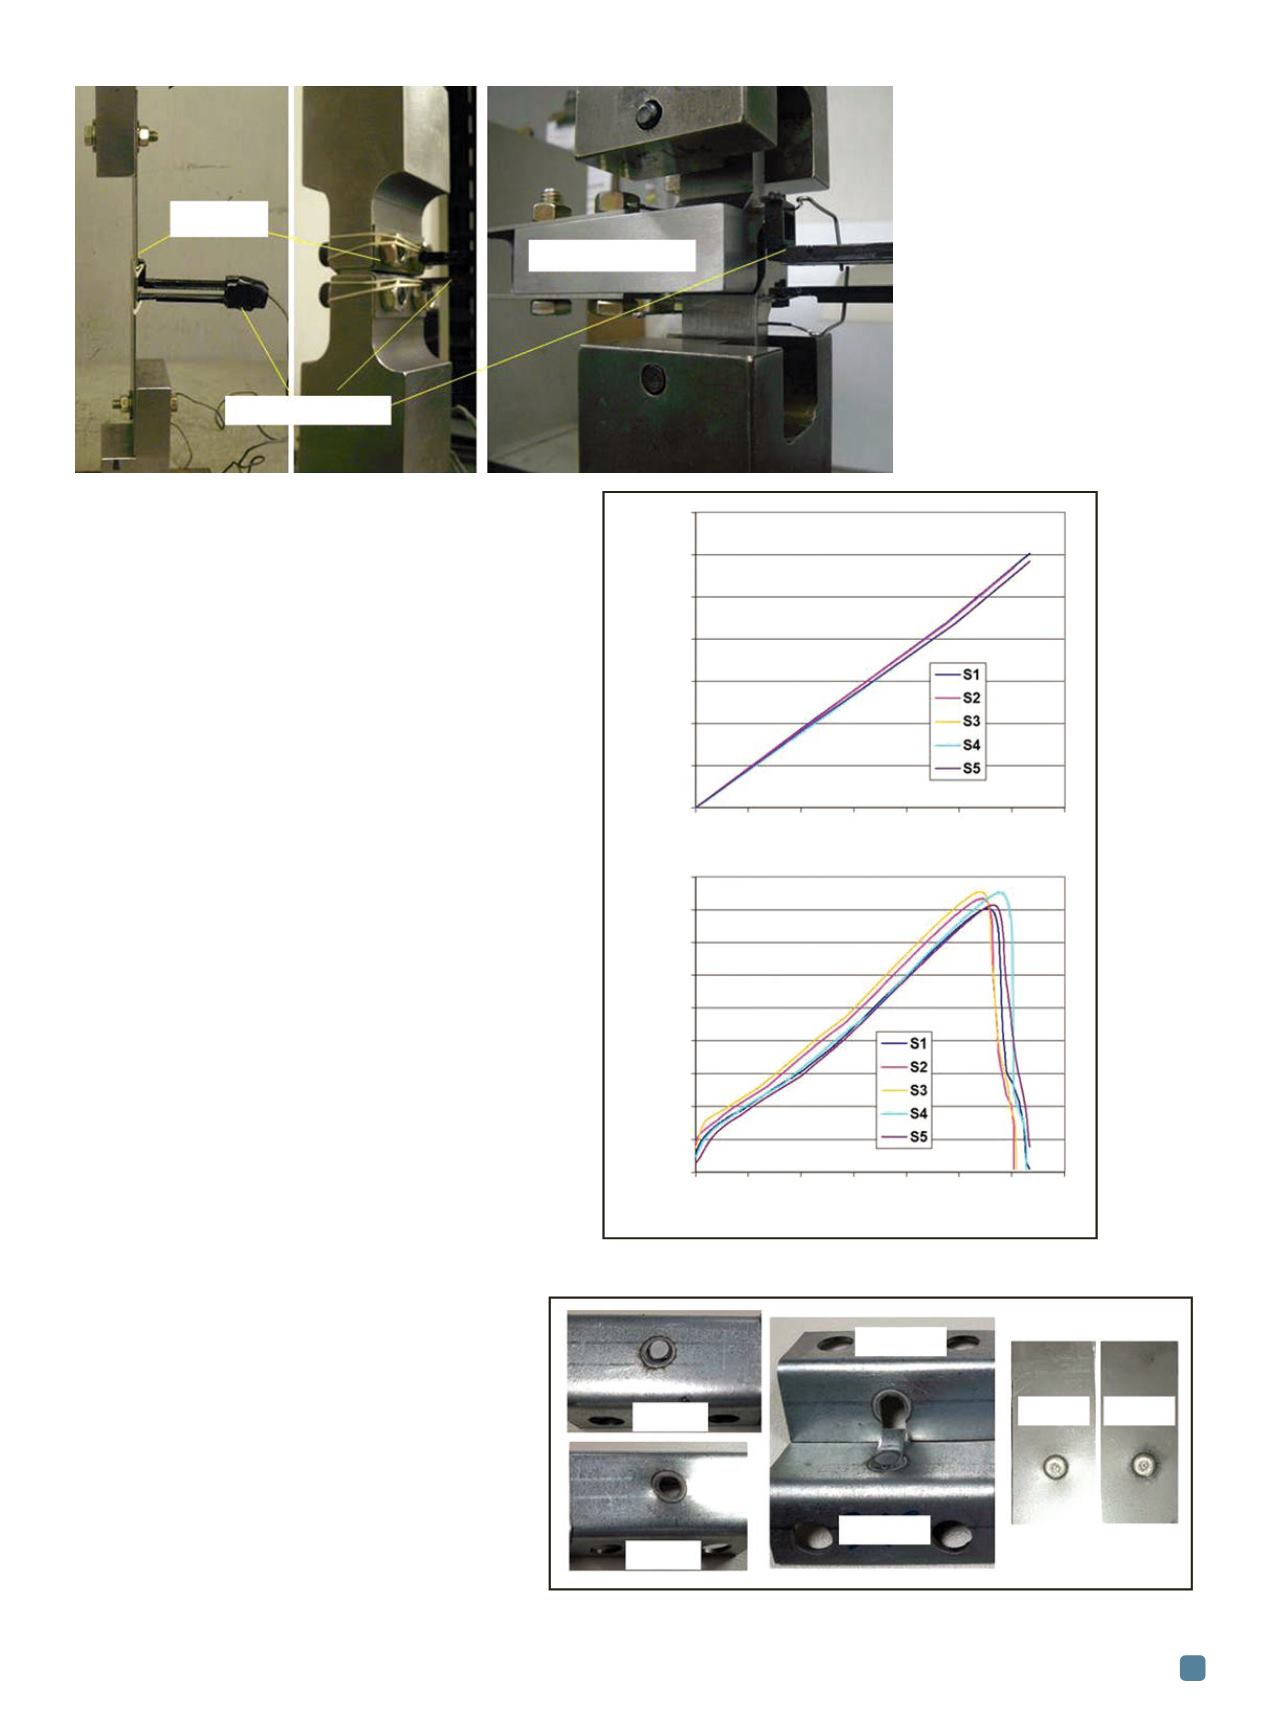
Fig. 5
—
Testing of
(a) lap-shear,
(b) coach-peel, and
(c) torsional samples.
(a) (b) (c)
Sample
Testing fixture
Extensometer
0 50 100 150 200 250 300 350
Time, s
0 50 100 150 200 250 300 350
Time, s
Fig. 6
—
Typical static testing results for KSII 90° samples:
(a) Displacement and (b) load curve for a spot weld.
Fig. 7
—
Typical broken samples for KSII, coach-peel, and lap-shear testing.
Coach-P1
KSII-P1 Lap-P1 Lap-P2
Coach-P2
KSII-P2
7.0
6.0
5.0
4.0
3.0
2.0
1.0
0.0
Displacement, mm
4.5
4.0
3.5
3.0
2.5
2.0
1.5
1.0
0.5
0.0
Load, kN
(a)
(b)