


 20 / 78

longitudinal load, respectively
[5]
. Testing was modeled
using finite element analysis (FEA) to predict spot weld
failures by inputting the failure parameters developed from
the small samples, and then comparing these with testing
results to validate the spot weld failure parameters.
Sample fabrication
Sheet metal was cut and formed into the C-channel
shape according to the dimensions shown in Fig. 1. Weld
fixtures were designed to prepare the samples and weld-
ing procedures were supplied by the automotive manufac-
turer. Figure 3 shows the welded KSII, coach-peel,
lap-shear, and torsional samples with one spot weld. Weld
size could be either the minimum size (normally 4√
t,
where
t
is the sheet thickness in mm) or the actual weld
size used in the vehicle. If the minimum size is selected,
the developed failure parameters will be conservative,
which is preferred for automotive structure design.
Holes were drilled in samples prior to welding, for bolt-
ing samples to fixtures and eliminating slippage during
testing. Holes were also added to the cover plate on the
long beam of the T-section sample, to attach the plate to
the fixture.
Small sample testing
Sample testing must be conducted with different strain
rates because a spot weld’s axial strength, shear strength, and
bending strength is a function of strain rate as shown in
Equation 1. Typically, three strain rate tests are conducted
including static testing for low strain rate, intermediate
speed testing for medium strain rate, and high-speed testing
for high strain rate. Note that high-speed testing is more im-
portant than static testing because most crash impact test-
ing is conducted at high speeds, such as 50 mph or higher.
Testing fixtures are designed to simulate the rigid
conditions in automotive spot welded structures for
small sample testing. Figures 4 and 5 show the testing
fixture used for KSII-90°, KSII-60°, KSII-30°, KSII-0°, lap-
shear, coach-peel, and torsional samples. The same test-
ing fixtures are used for static, intermediate, and
high-speed testing.
Both static and intermediate speed tests are performed
with an electromechanical test system at a 50 mm/min and
50 mm/second crosshead speed, respectively. Sample dis-
placement is measured using both an extensometer, as
shown in Figs. 4 and 5, and the crosshead positioning sys-
tem. Load is recorded by a load cell.
Figure 6 shows a typical
load vs. time
and
displacement
vs. time
graph for a spot weld static test. Five tests were
conducted for the same conditions to check data repeata-
bility. Small variations resulting from weld size differences
were found, and the peak load was used to determine spot
weld joint strength for developing failure parameters. Load
curve after peak load was used to determine damage pa-
rameters. Figure 7 shows broken samples for KSII, coach-
peel, and lap-shear testing. KSII and coach-peel samples
exhibit pullout-button failure, while the lap-shear sample
shows interfacial failure.
High-speed tests were performed on a modified Dy-
natup Model 8250 (General Research Corp.) instrumented
drop weight tower, shown in Fig. 8. Consistent with static
tests, the same upper and lower sample holders using bolts
ADVANCED MATERIALS & PROCESSES •
NOVEMBER-DECEMBER 2014
20
Cover plate
Long beam
Transverse
load
Spot weld
Longitudinal load
Fig. 2 —
A
component sample
used to validate
spot weld failure
parameters.
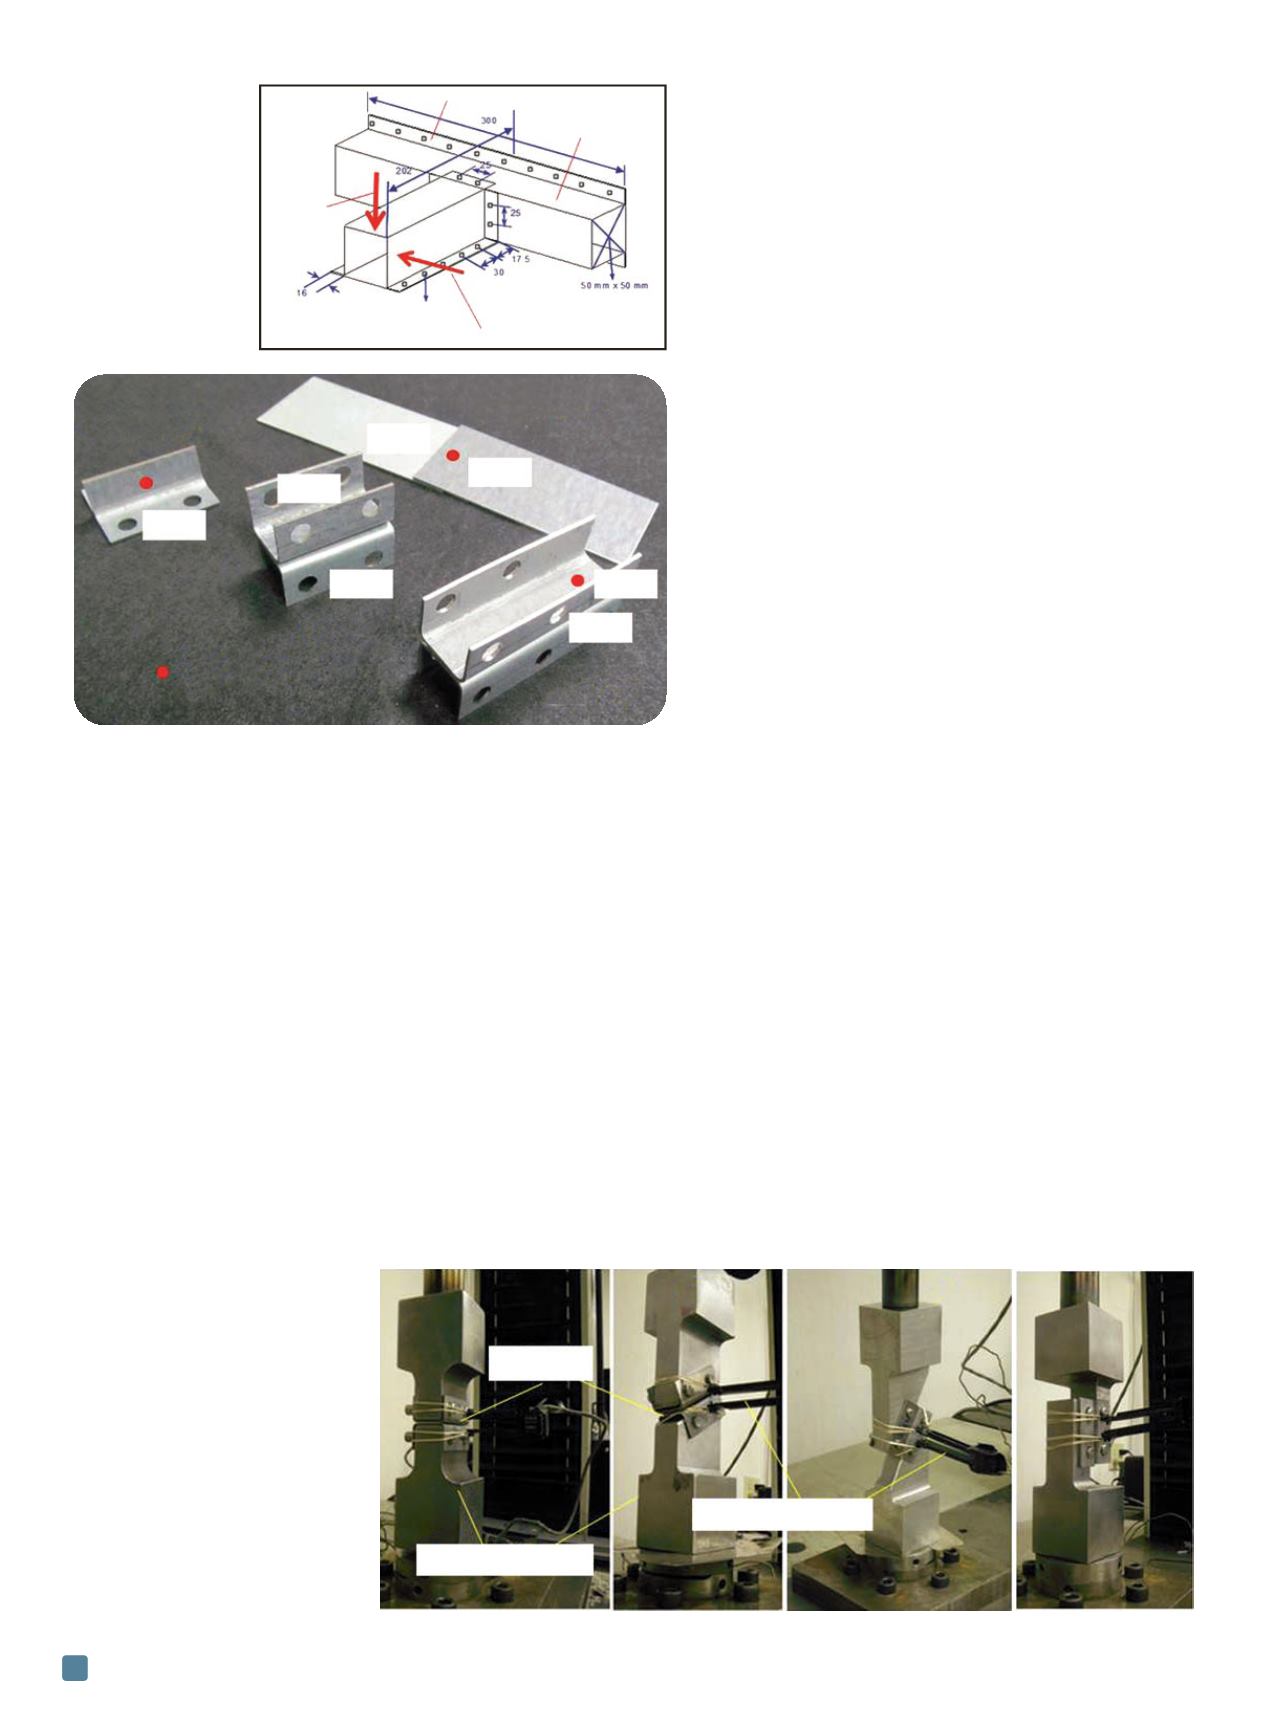
Fig. 3 —
Welded versions of small samples.
Coach-peel Lap-shear
Part 1
Part 2
Part I
Part 2
Part 2 Part I
KSII
Part 2
Spot weld
Torsion
Fig. 4
—
KSII sample
testing: (a) 90° loading,
(b) 60° loading,
(c) 30° loading, and
(d) 0° loading.
(a) (b) (c) (d)
Sample
Extensometer
Testing fixture