


 34 / 66

edfas.org
ELECTRONIC DEVICE FAILURE ANALYSIS | VOLUME 18 NO. 4
34
(continued on page 36)
wafers (Fig. 2). In process development, 3-D structures
fabricatedwith a newormodifiedprocess often require
validation prior to the next step. 3-D XRM imaging of
specific critical structures, for example, gives direct
physical evidence for the process engineer to analyze
and unravel potential process issues. The benefits of
3-D x-ray include:
• Minor to no sample preparation
• Virtual cross sectioning leads to fully nondestruc-
tive FA
• 3-D navigation for FIB cross sectioning
• Electro-optical terahertz pulse reflectometry
(EOTPR)
has been introduced as a replacement for TDR
applications by using a novel gigahertz-range pulse
reflectometry.
[7-11]
During operation, electrical pulses
are launched into the device under test via a high-
frequency circuit probe. Reflections fromdevice struc-
tures and faults are recorded as a voltage-time wave-
formby a fast photoconductive switch. This broadband
technique has an extremely low time-base jitter and
high temporal resolution. As a result of its principle,
EOTPR can outperformclassic TDRmeasurements and
enable early defect isolation, whether in the package
substrate, the die-substrate interface, or the die itself.
An example can be seen in Fig. 3, where the difference
in signal travel led to the detection of a missing C4
bump connection.
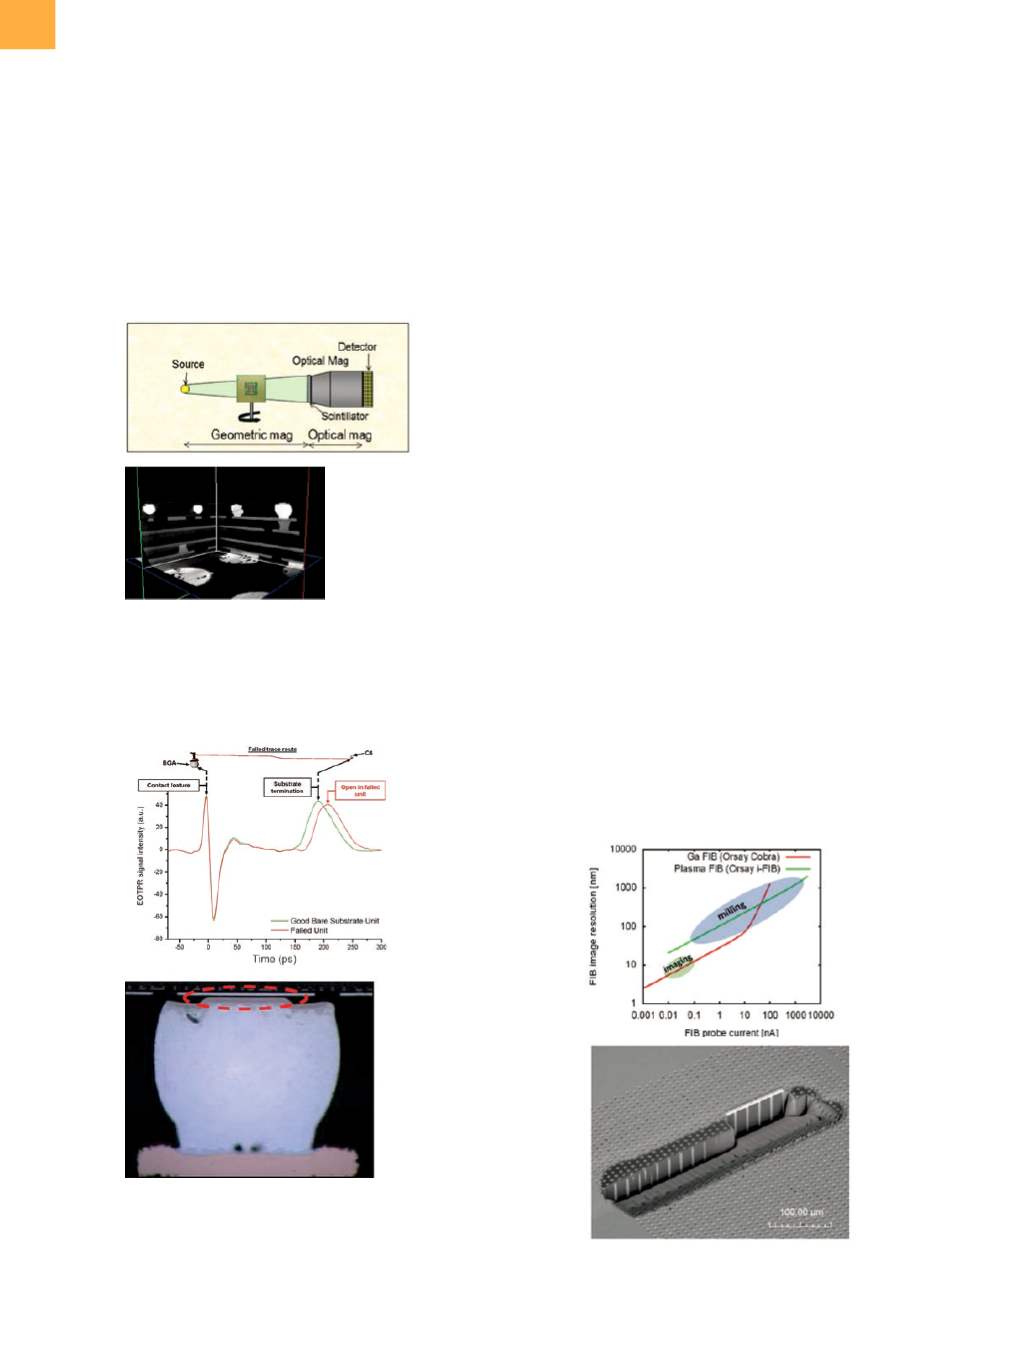
• (Xenon) plasma FIB
has been developed based on the
widely used galliumFIB (Ga-FIB) applications. It benefits
fromamuchhigher beamcurrent in themicroamp range,
which enables large cross sections on package samples
within 1 to 2 h. Figure 4 shows a comparison of FIB image
resolutionas a functionof beamcurrents for gallium- and
xenon-sourced FIBs.
As seen in Fig. 4(a), for beam currents above ~50 nA,
the spot size for the plasma FIB is noticeably smaller
Fig. 2
(a) Operational principle of 3-D x-ray. Using sample
rotation, several 2-D x-ray images are taken and
processed. (b) As a result, a 3-Dmodel is created that
allows selective “virtual cross sectioning” of any
desired
x-y-z
-layer.
(a)
(b)
(a)
(b)
Fig. 3
(a) Introducing a high-frequency signal into the
sample and measuring the time of flight of the
reflected response allows a simple reference-versus-
failing device comparison. (b) Cross sectioning
and root-cause imaging of an open C4 bump after
successful EOTPR measurement
EMERGING TECHNIQUES FOR 2-D/2.5-D/3-D PACKAGE FAILURE ANALYSIS
(continued from page 31)
(a)
(b)
Fig. 4
(a) Comparisonof resolutionversus current forGa-FIB
and plasma FIB. (b) Demonstration of TSV cross
sectioning