


 13 / 66

edfas.org
13
ELECTRONIC DEVICE FAILURE ANALYSIS | VOLUME 18 NO. 4
is usually caused by a very subtle defect that may be very
difficult tofind. Tomaintain a highPFA success rate for soft
failures, fault isolation is often performed prior to destruc-
tive PFA. In this case, LVI and LVPwere again employed for
the fault isolation. The LVI image of the clock signal and
the data signal for a reference scan chain, SO3, and the
failing scan chain, SO5, is shown in Fig. 15. It shows that
the clock signal (in yellow) appears to be acceptable in
both scan chains, while the data signal (in blue) stops at
the latch callout for SO5 and continues to propagate for
Fig. 14
FIBcross sectionshowinghollowV2 in the clock signal
line from the clock buffer to the latch callout
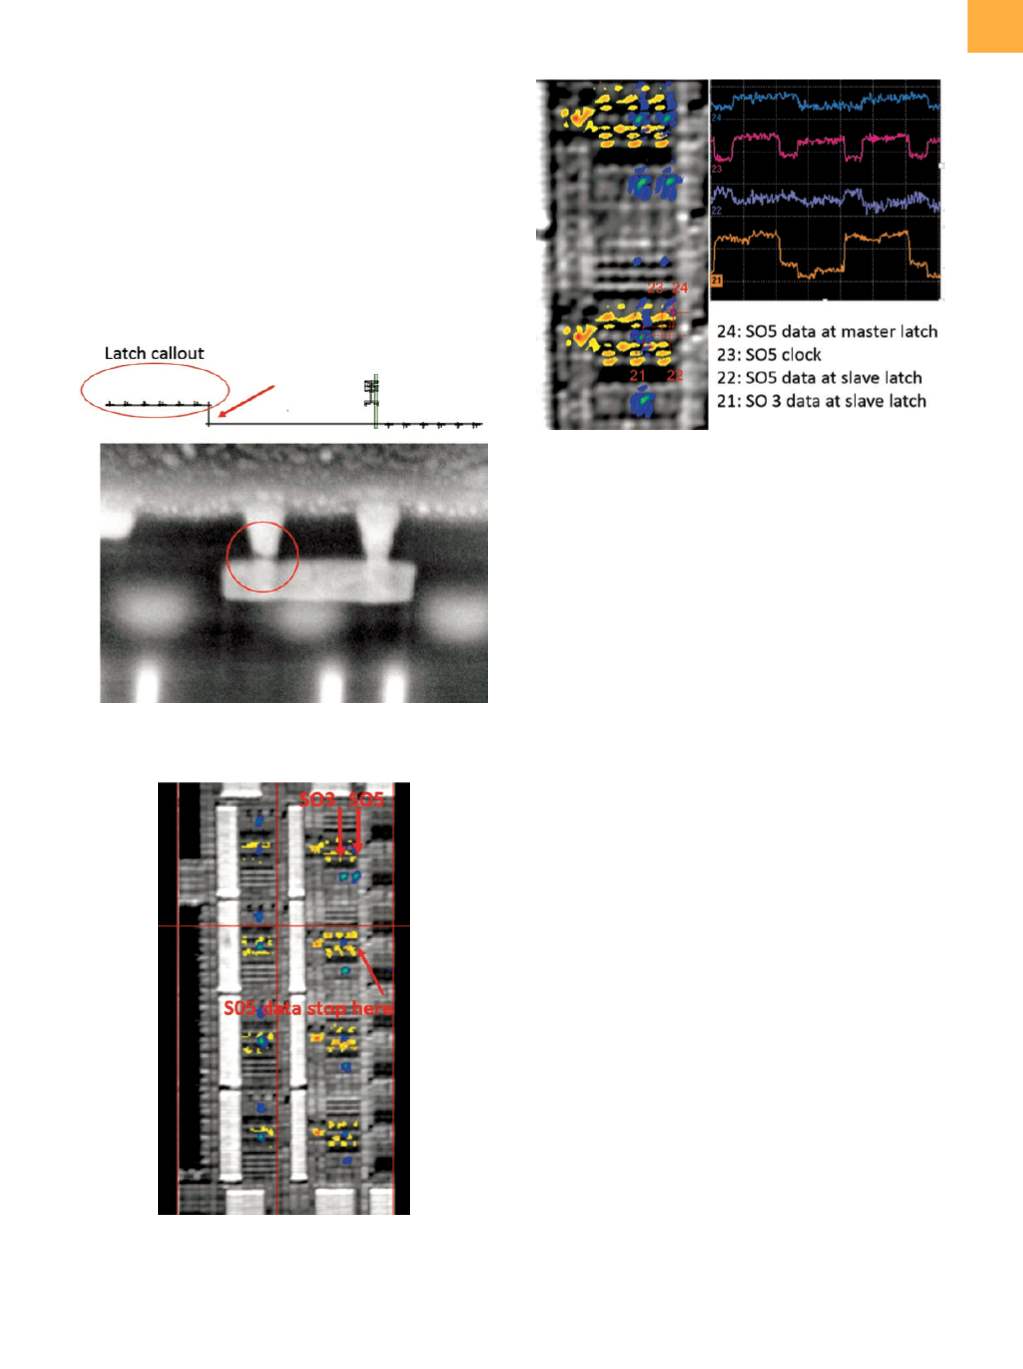
Fig. 15
LVI image of data signal and clock signal for a
reference scan chain, SO3, and the failing scan chain,
SO5, indicating a broken point at the latch callout for
the failing scan chain, SO5
Fig. 16
LVP waveforms from the master latch of the latch
callout, the slave latch from the latch callout, and
the adjacent reference latch, indicating datamissing
at the slave latch for the latch callout
SO3. The higher-resolution LVI image (Fig. 16) from the
feeding latch and the latch callout showed that the data
actually had propagated to the master latch of the latch
callout but had not transferred to the slave latch. This
was further verified with LVP waveforms collected from
the master and slave latches, as shown at the right in Fig.
16. The subsequent PFA found a gate-to-source-resistant
short defect, which was responsible for the scan chain
single-latch soft failure.
SUMMARY
The unique capability of LVI to map periodic signal
propagation makes it very useful in scan chain diagno-
sis. For scan chain clock-type failures or single-latch soft
failures, routine PFA with top-down SEM inspection often
found no defect. Laser voltage imaging can clearly show
the broken point of the clock signal or data signal for
these failures. Follow-up LVP probing can further confirm
the failing nodes and help explain the failure signature.
Employing LVI and LVP in the diagnostic analysis greatly
improves the in-line scan chain logicmacro failure analysis
success rate.
ACKNOWLEDGMENTS
TheauthorsappreciateThuySuandLarryBreitenberger
for their help in physical failure analysis, and Christopher
Hodge, Manuel Villalobos, and John Sylvestri for their
diagnostic test and imaging assistance.
REFERENCES
1. S. Naik, F. Agricola, and W. Maly: “Failure Analysis of High Density
CMOS SRAMs,”
IEEE Des. Test. Comput.,
1993,
10
(2), p. 13.