
The left and right numbers shown in the upper portion of
each ultrasonic image indicate nondestructively estimated
nugget diameter and area, respectively. Nugget size did not
improve much after five cycles. For both rows, the overall
increase in nugget size was less than 10% after five cycles.
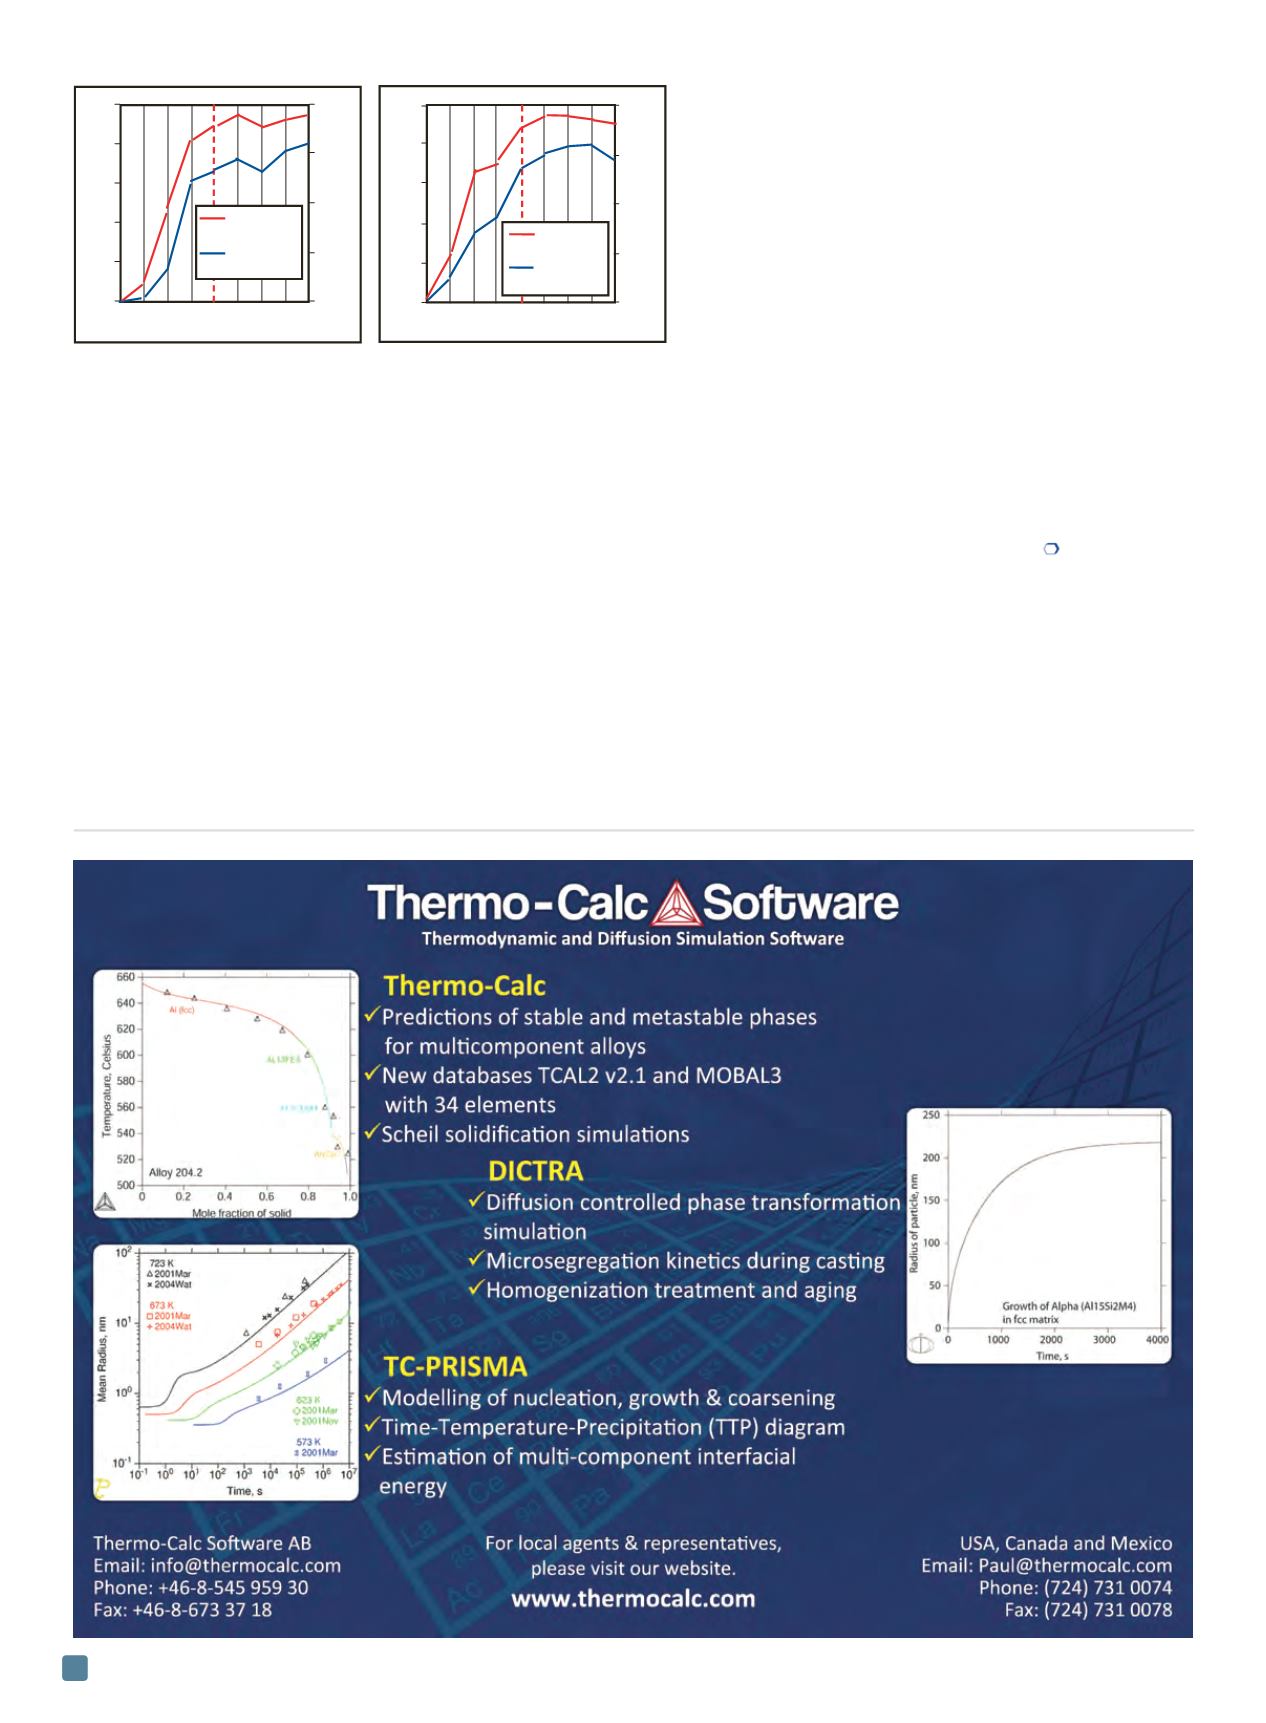
Graphs in Fig. 5 were generated using the ultrasonic
images in Fig. 4, showing improvements made to nugget
diameter and fused area as the number of weld cycles in-
creased. Diameter and area improvement start saturating
once the number of cycles is higher than five at 6 KA of
constant current.
Conclusions
A high-frequency ultrasonicMPA probe designed to per-
form nondestructive inspection of resistance spot welds on
automotive chassis was developed and tested. Based onmod-
eling and simulation results, a water delay line with a length
of 18 mm produced the best penetration of ultrasonic sig-
nals at the water and metal interface, as well as throughout
the metal interface where resistance spot weld nuggets form.
An innovative electronic dual-gate imaging process discrim-
inates fused and unfused sections of the weld and displays
results in a color-coded C-scan format for easy interpreta-
tion. Average nugget diameter and fused area data are also
displayed in real-time to provide realistic operator feedback.
NDI results of spot welds made on two 0.7-mm metal
sheets with different cycle numbers at a constant electrical
current level show that a good weld nugget with an accept-
able diameter and fused area could be formed after four or
five cycles. The number of cycles currently used on auto-
motive chassis may be reduced to save time and cost with-
out over-welding with additional cycles.
For more information:
Ne Jeong is technology leader,
EWI, 1250 Arthur E. Adams Dr., Columbus, OH 43221,
614/688-5206,
jna@ewi.org,
www.ewi.org.
References
1. J. Gould and W. Peterson, Advanced Materials Require Ad-
vanced Knowledge - Understanding Resistance Spot Weld
Performance on AHSS.
The Fabricator,
Vol 35, No. 8, 2005.
2. D. Hopkins and the USAMP NDE Steering Committee, Re-
liability in High Volume Manufacturing: An Automotive Per-
spective.
Materials Evaluation,
2007.
ADVANCED MATERIALS & PROCESSES •
MARCH 2014
24
Fig. 5 —
Increase in nugget diameter and fused area as a function of
number of cycles for each row. Data is based on ultrasonic image data
shown in Fig. 4.
l
l
l
l
l
l
l
l
l
n
n
n
n
n
n n
1 2 3 4 5 6 7 8 9
Number of cycles
1 2 3 4 5 6 7 8 9
Number of cycles
5
4
3
2
1
0
5
4
3
2
1
0
20
15
10
5
0
20
15
10
5
0
Nugget area, mm
2
Nugget area, mm
2
Nugget diameter, mm
Nugget diameter, mm
n
Nugget
diameter
Nugget
area
n
l
n
n
n
n
n
n n n n
l
l
l
l
l
l
l l
l
n
l
Nugget
diameter
Nugget
area


