


 23 / 62

ADVANCED MATERIALS & PROCESSES •
MARCH 2014
23
time with feedback. This new NDI system
not only reduces the need for destructive
testing of spot welds in manufacturing, but
also assesses the structural integrity of prod-
ucts with great cost-savings and efficiency.
In order to generate 2D C-scan weld images, the
phased array electronic circuit first activates the MPA
probe with commands from the data processing software.
Ultrasonic signals detected by the MPA probe are then fed
into the imaging algorithm for the fused and non-fused
joining areas being inspected. A color-coded ultrasonic C-
scan image and additional data such as nugget diameter
and fused area are displayed on the screen.
The system processes ultrasonic signals as
they are detected by individual subgroups of the
probe array using two electronic gates, one for
the front surface reflection and the other for in-
terface reflection. An ultrasonic image is plotted
as raw ultrasonic data is processed in real-time
with the dual gate imaging algorithm. Operator
feedback occurs in a fraction of a second and
probe adjustment is relatively fast and easy com-
pared to other systems that require probe repo-
sitioning if results are unsatisfactory.
Test results
A set of resistance spot welds with two-sheet stackups
and thicknesses at the lower limit of 0.7 mm were prepared.
Two rows of nine spot welds each were placed on the test
sample shown in Fig. 3. For this sample, a constant current of
6 kA was applied for all welds, while the number of cycles
was varied from 1-9 at an increment of one cycle for each
weld. Spot welds on the sample stack were tested using the
SpotSight inspection system and results are shown in Fig. 3.
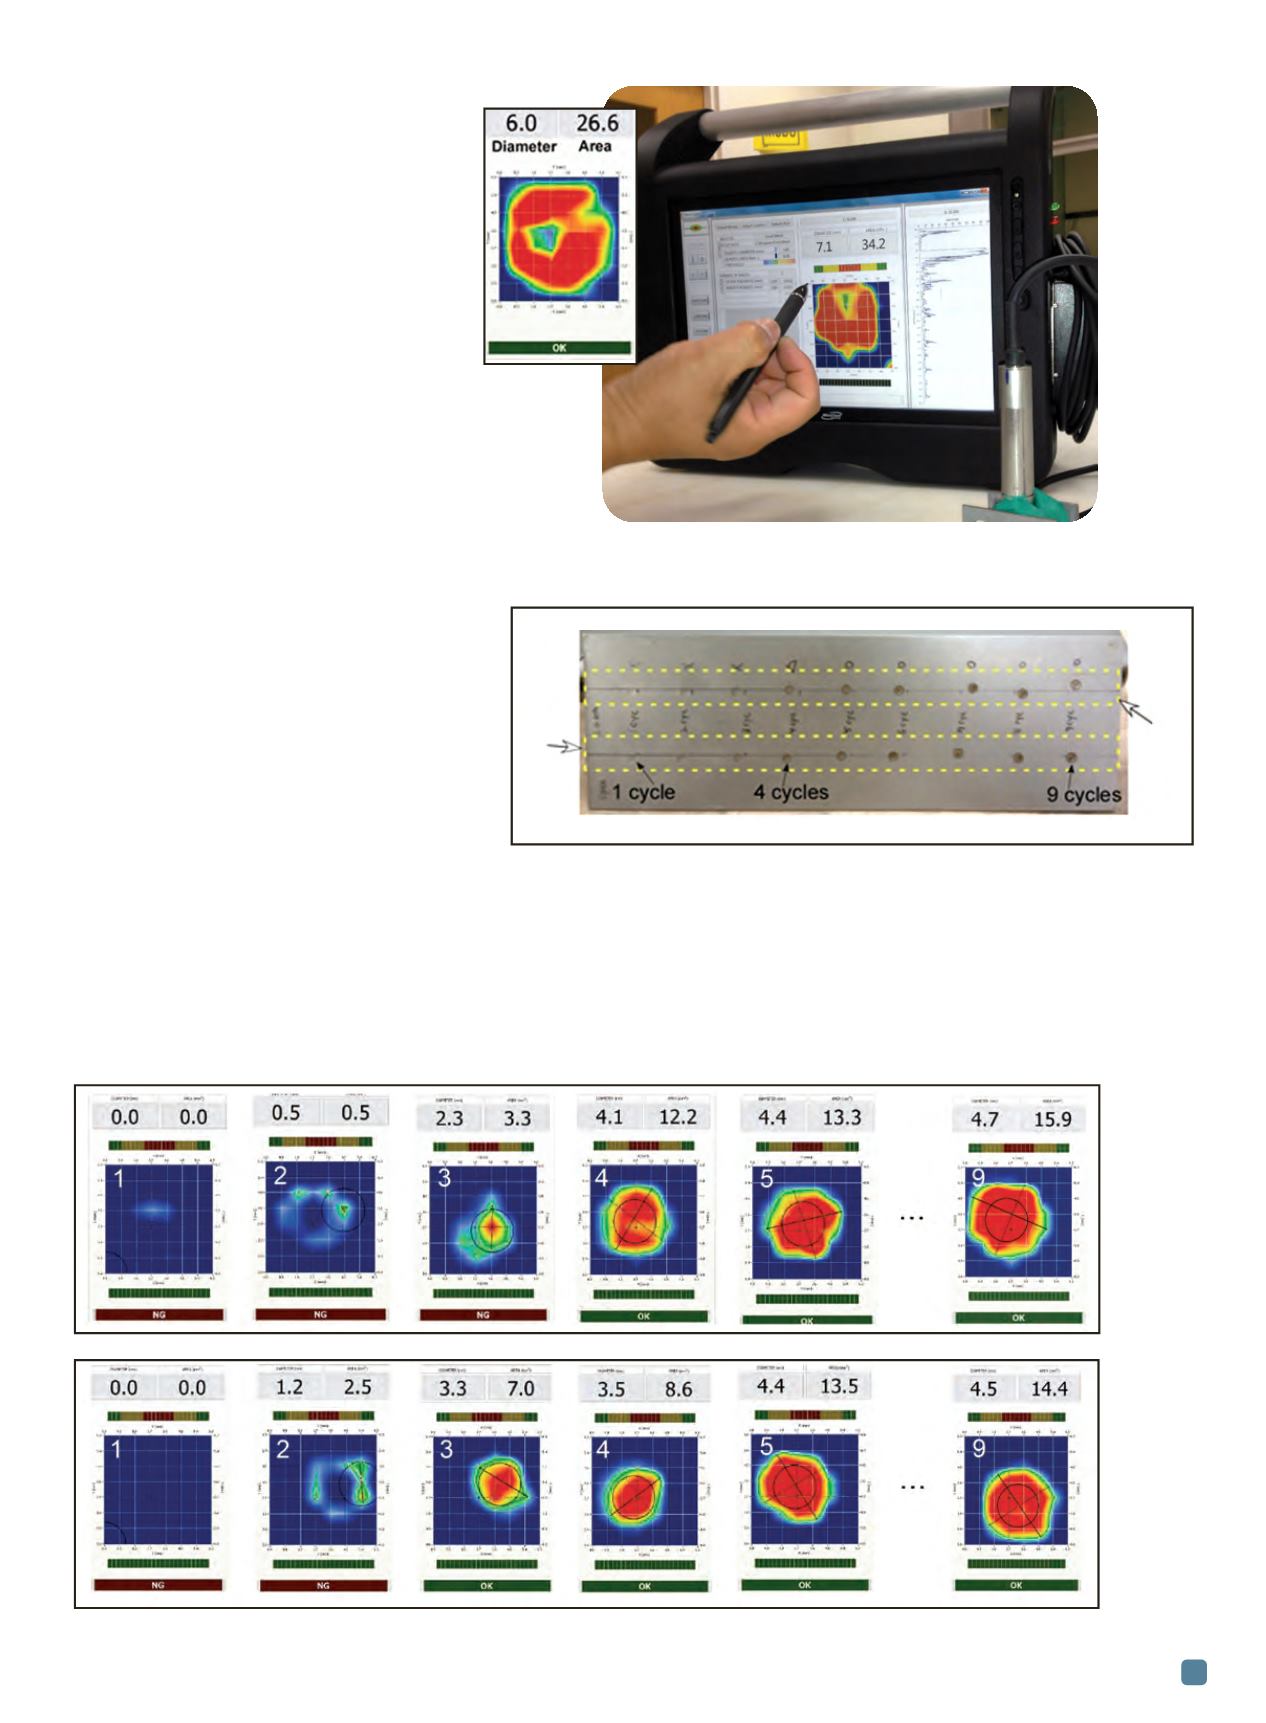
The number in the upper left corner of each image in
Fig. 4 indicates howmany electric current cycles were used
to form weld nuggets. For both upper and lower rows, an
acceptable spot size weld was measured after five cycles.
Fig. 2 —
EWI SpotSight ultrasonic nondestructive inspection
system and C-scan image of a resistance spot weld nugget
with porosity in the center section (inset).
Lower
Upper
row
row
Fig. 3 —
Test sample with two rows of resistance spot welds.
Fig. 4 —
Ultrasonic
images of
spot weld
nuggets
for the
test
sample
plate
shown in
Fig. 3.
Welds in
the upper
row (a),
welds in
the lower
row (b).
(a)
(b)