



 15 / 54

boundaries, and contain some intriguing ribbons of recrys-
tallized nanocrystalline grains, yet little grain refinement has
occurred. Closer inspection of the shear band shows a grain
size in the region of 100-500 nm, although some grains are
as long as 2-3 µm. Contrary to interpretations of TEM im-
ages, grains are generally elongated and contain many low
angle boundaries, shown by gray lines in Fig. 2.
A more detailed investigation of part of one such shear
band is shown in Fig. 3. Here, the TKD step size is 5 nm
and the elongated nature is clear, especially in the lower
part of the area. Despite the presence of grains that extend
across the whole field of view (2.5 µm), mean grain diam-
eter in this area is 208 nm (118 grains), compared to 170
nm (2064 grains) measured from the complete shear band
shown in Fig. 2. Analysis using conventional EBSD would
be impossible due to both the small grain size and highly
deformed nature of the crystal lattice.
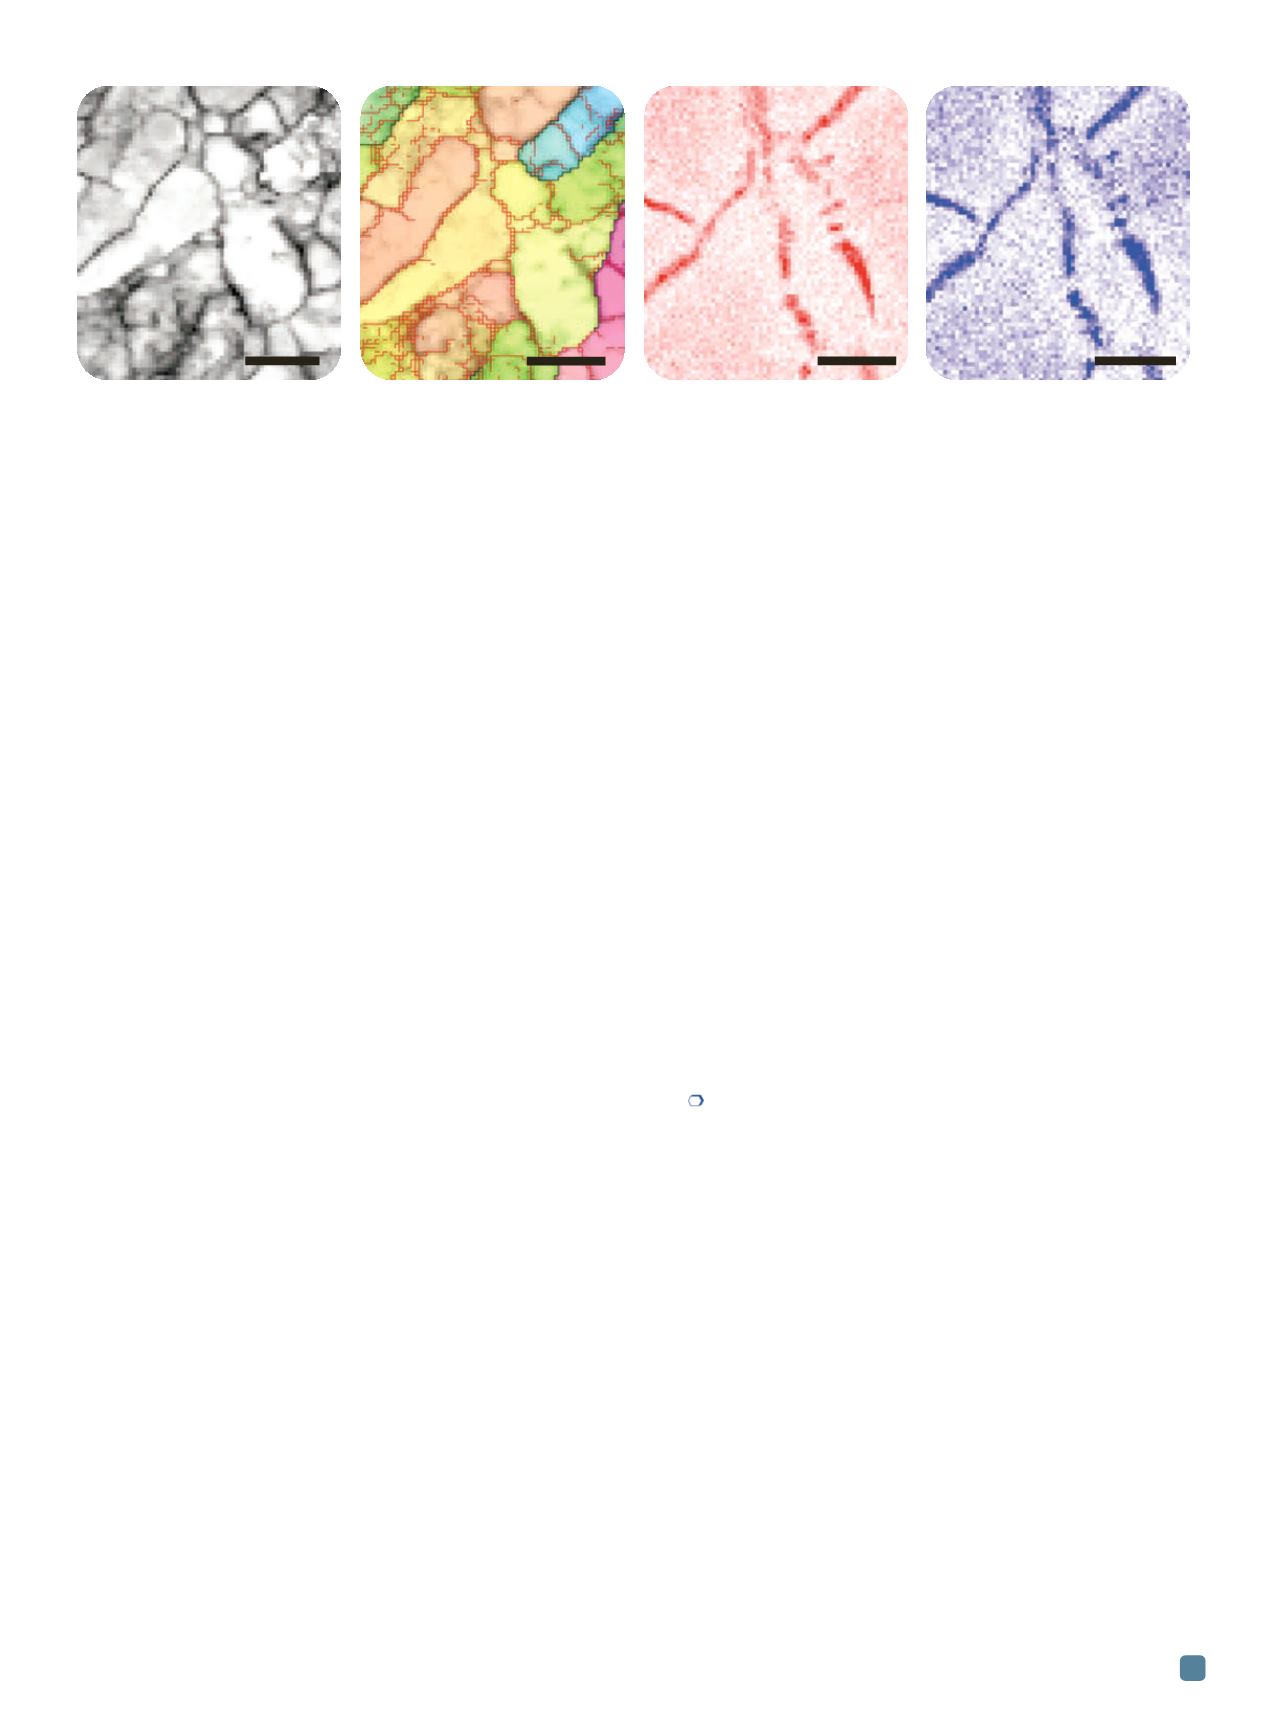
A detailed TKD orientation map of part of an artifi-
cially aged Al-Mg-Cu alloy is shown in Fig. 4a. Here, the
EBSD detector collected high resolution diffraction pat-
terns, enabling significantly improved orientation accuracy
(better than ± 0.2°); the longer dwell time at each point im-
proves the x-ray count, enabling high quality chemical
mapping simultaneous to TKD measurements. The red
lines in Fig. 4b mark low angle boundaries above 0.5° mis-
orientation, while black lines represent high angle bound-
aries (>10°). The maps in Figs. 4c and 4d show the
distribution of Mg and Cu respectively.
Several features of the microstructure are prominent:
The very fine scale cell structure, dominated by low angle
boundaries (the field of view is only 750 nm across), plus
clear segregation of Mg and Cu into the boundaries. A
closer look at the chemical segregation is even more in-
triguing—only some boundaries show any segregation, and
there is no clear preference towards segregation at either
high or low angle boundaries. The ability to correlate crys-
tallographic and chemical data with exceptional spatial res-
olution (the Cu- and Mg-enriched zone across these
boundaries is, in places, only 2 pixels or 20 nm across) and,
potentially, to cover large numbers of grains is unique to
integrated TKD-EDS mapping in the SEM and is proving
an invaluable technique to unlocking the secrets of these
deformed Al alloys.
Conclusions
Occasionally a new technique emerges that can dra-
matically enhance our ability to characterize materials on
the micro- or nano-scale. The recent “discovery” of TKD in
the SEM is different: It is a technique that uses instrumen-
tation that is both widely available and easily used, yet
promises remarkable improvements in spatial resolution
compared to existing techniques. The examples shown in
this article illustrate the power and versatility of the tech-
nique. Even on a light metal such as an Al-Mg-Cu alloy,
TKD permits fast orientation mapping with spatial reso-
lution better than 10 nm, and chemical mapping using si-
multaneous EDS with resolution on the order of 20-30 nm.
This allows the routine characterization of true nanocrys-
talline materials in the SEM, offering grain size, boundary,
texture, phase, and chemical measurements on a scale oth-
erwise unachievable without using a TEM.
Potential applications of TKD for materials character-
ization are wide ranging. Up until now the focus has been
primarily on bulk nanocrystalline materials in which the
grain size is below the limit of conventional EBSD, but the
improved spatial resolution also enables analysis of highly
deformed structures
[8]
. Ongoing research using TKD has
provided orientation data on materials as diverse as super-
conductors, solar cells, fuel cells, nanoparticles, and even
iron oxides in magnetotactic bacteria. The impact of this
new and exciting technique will only increase in the com-
ing years.
For more information:
Patrick Trimby, Australian Centre for
Microscopy &Microanalysis, The University of Sydney, Mad-
sen Building F09, NSW, 2006, Australia, 612/9351-7561,
patrick.trimby@sydney.edu.au,
http://sydney.edu.au/acmm.Acknowledgements
The authors wish to thank Morgan Tort (The University of
Melbourne, Australia) for providing the samples and permit-
ting the authors to show results, and Deirdre Molloy for help-
ing with Fig. 1.
References
1. F.J. Humphreys,
Scripta Mater.
51, 771-776, 2004.
2. E.O. Hall,
Proc. of the Physical Society, Series B
64, 747-753,
1951.
3. N.J. Petch,
J. of the Iron and Steel Institute
, 25-28, 1953.
4. C. Suryanarayana, C.C. Koch,
Hyperfine Interact.
, 130,
5-44, 2000.
5. R.R. Keller, R.H. Geiss,
J. of Microscopy
245, 245-251, 2012.
6. K. Tugcu, et al.,
Mater. Sci. Eng., A
552, 415-418, 2012.
7. P.W. Trimby,
Ultramicroscopy
120, 16-24, 2012.
8. P.W. Trimby, et al.,
Acta Mater.
62, 69-80, 2014.
ADVANCED MATERIALS & PROCESSES •
FEBRUARY 2014
15
Fig. 4
—
Corresponding TKD and EDS element maps of an artificially aged ECAP-deformed Al-Mg-Cu alloy. (a) TKD diffraction pattern quality
map. (b) TKD orientation map, with low angle boundaries (0.5-10°) in red, high angle boundaries (>10°) in black. (c) Mg distribution map.
(d) Cu distribution map.
200 nm
200 nm
200 nm
200 nm
(a) (b) (c) (d)