



 13 / 54

ADVANCED MATERIALS & PROCESSES •
FEBRUARY 2014
13
Transmission Kikuchi Diffraction in the Scanning Electron Microscope:
Orientation Mapping on the Nanoscale
E
lectron backscatter diffraction (EBSD)
is one of the most established microan-
alytical techniques for characterizing
microstructures of crystalline materials. EBSD
application has grown dramatically since the
first commercial systems became available in
the early 1990s, as today most materials charac-
terization laboratories have access to an EBSD
system. Reasons for its popularity include
speed, ease of use, and the extensive range of
applications in which it can be used. The pri-
mary reason, however, is that EBSD provides
unique information at an impressive spatial res-
olution. On a field emission gun scanning elec-
tron microscope (FEG-SEM), EBSD can
measure phase and orientation from domains
as small as 100 nm
[1]
. The exact value depends
on the material in question, but EBSD can ef-
fectively characterize materials with grain sizes
in the sub-micrometer range.
The Hall-Petch relationship, observed in the
early 1950s, in which yield strength in materials
was demonstrated to be inversely related to grain
size
[2,3]
, has inspired materials scientists to pro-
duce finer grained materials. As grain size ap-
proaches the nanocrystalline range (i.e., under
100 nm), a material’s physical properties change
dramatically and are often superior to conven-
tional microcrystalline materials. Not only do
strength and hardness increase, but fatigue re-
sistance, diffusivity, and even magnetic proper-
ties are shown to improve
[4]
. The small grain
sizes of these materials pose a problem for mate-
rials characterization: With mean grain sizes in
the 100 nm range, EBSD, even on a FEG-SEM,
does not have the necessary spatial resolution.
The solution has been to turn to the transmis-
sion electron microscope (TEM), in which the
higher electron beam energy and low beam
spread through electron transparent samples
combine to offer subnanometer resolution.
In the last few years, a simple yet innovative
alternative strategy was proposed by a group of
researchers at the National Institute of Standards
and Technology (NIST), Boulder, Colo., led by
Robert Keller and Roy Geiss. They demon-
strated that a conventional EBSD system in a
FEG-SEM could be used to collect diffraction
patterns from sub-10 nm domains in an electron
transparent sample
[5]
. They named it transmis-
sion EBSD, or t-EBSD. By simply changing the
setup and using electron transparent samples
(such as those used for TEM studies), hundreds
of laboratories worldwide have access to a char-
acterization technique that is able to measure
grain sizes and orientations in nanocrystalline
materials. Realizing the potential of this ap-
proach, at the University of Sydney we started
combining automated orientation mapping with
t-EBSD and published some of our first results
in 2012
[6,7]
. Because the technique involves no
backscattering of electrons, we proposed a
more scientifically accurate name: Trans-
mission Kikuchi diffraction, or TKD.
TKD methodology
Setting up for automated TKD analy-
sis is relatively simple—samples need
to be thin, typically under 200 nm in
thickness (although for many materi-
als, below 100 nm is optimal). Standard
TEM sample preparation techniques
such as electropolishing or ion-beam
milling are usually sufficient. The sample
is then mounted in the SEM chamber in a
horizontal or sub-horizontal orientation,
close to the level of the top of the EBSD de-
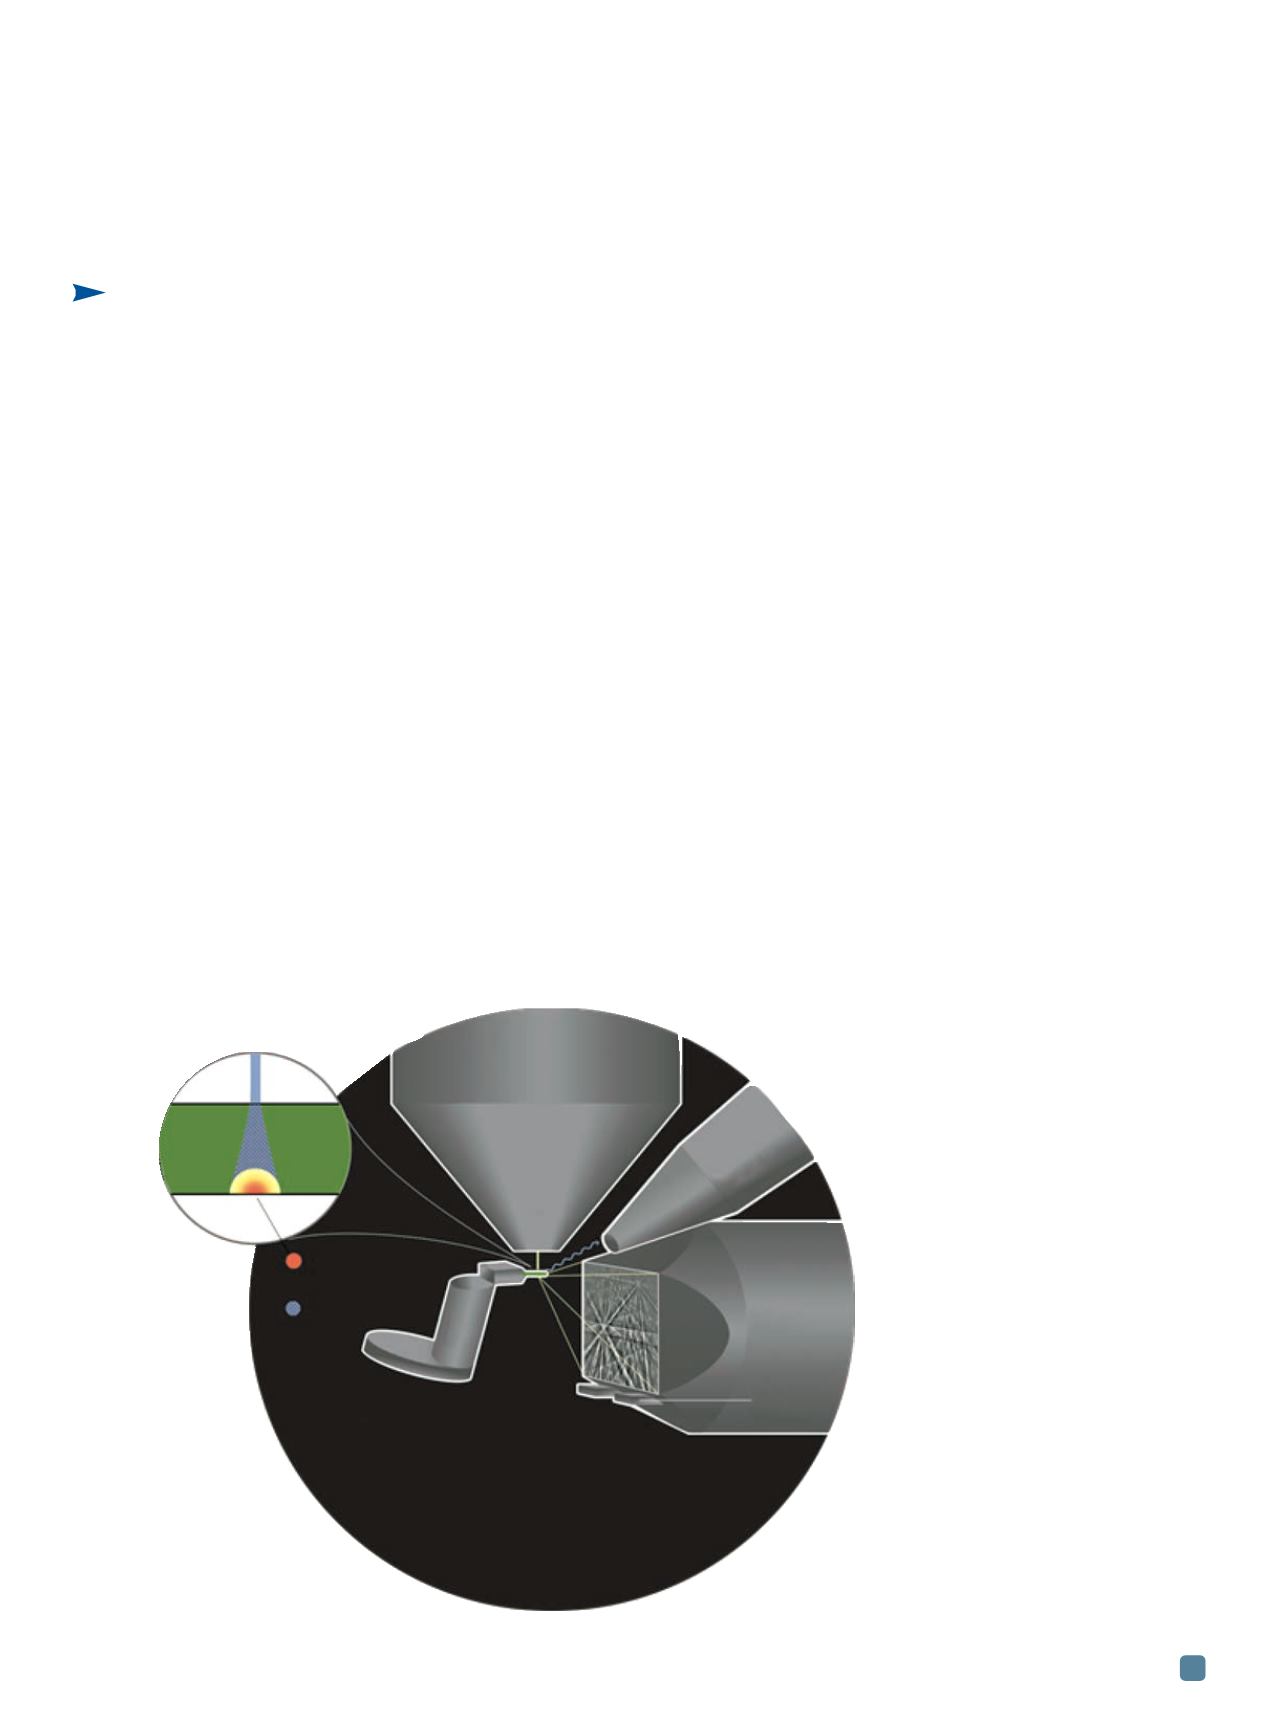
tector, as shown schematically in Fig. 1. The
electron beam, usually set to the highest accel-
erating voltage (30 kV for most SEMs), is focused
onto the sample and the Kikuchi diffraction pat-
Patrick W. Trimby
Julie M. Cairney
The University of
Sydney, Australia
By changing a
setup and using
electron
transparent
samples,
hundreds of
laboratories
worldwide have
access to a
characterization
technique that
measures grain
sizes and
orientations in
nanocrystalline
materials.
Fig. 1
—
Schematic rep-
resentation of the setup for
TKD in the SEM. The inset
highlights the source volumes
for electron diffraction and x-ray
excitation within an electron
transparent sample.
TEM
sample,
100 nm
thick
Diffraction source
volume
X-ray source
volume
SEM
electron
column
SEM
stage
EDS detector
EBSD
detector
Forescatter
detector
(dark field)