



 14 / 54

tern is projected from the bottom surface of the sample onto
the EBSD detector to the side. Standard commercial EBSD
software indexes the diffraction pattern: Indexing speeds are
similar to conventional EBSD, between 20 and 100 analyzed
points per second, which allows orientation maps to be col-
lected by stepping the electron beam across the sample sur-
face on a regular grid of points. The horizontal sample
orientation is also ideal for simultaneous chemical analysis
using energy dispersive x-ray spectroscopy (EDS), provid-
ing elemental distributions on the submicron scale. The
measurement spacing (step size) for automated TKD analy-
ses is routinely between 2 and 20 nm.
The spatial resolution of the TKD technique depends
on a number of factors. The electron beam is scattered as
it interacts with the sample, and some of these scattered
electrons will impinge on crystal lattice planes at the nec-
essary Bragg angle for diffraction. The diffracted electrons
form the Kikuchi bands that make up the diffraction pat-
tern. However, those electrons that are scattered in the
upper part of the sample are likely scattered further before
exiting towards the detector, meaning they will not con-
tribute significantly to the diffraction pattern. The end re-
sult is that the diffraction pattern originates close to the
lower surface of the sample (Fig. 1 inset), enabling effec-
tive analysis even when grain size is significantly smaller
than sample thickness. Many of the first results using TKD
demonstrate effective spatial resolution for various mate-
rials between 2 and 10 nm
[5, 7, 8]
.
Results were collected at the Australian Centre for Mi-
croscopy and Microanalysis using a Zeiss Ultra FEG-SEM
equipped with an Oxford Instruments Nordlys Nano EBSD
detector, an X-Max 20 EDS detector, and running AZtec
v2.2 software.
Application examples
The following examples all come from a series of Al-Mg-
Cu alloys subjected to severe plastic deformation using equal
channel angular pressing (ECAP). Samples underwent vary-
ing aging processes prior to deformation, resulting in signif-
icant variations in the final microstructures. All samples
were subjected to 4-pass ECAP at room temperature.
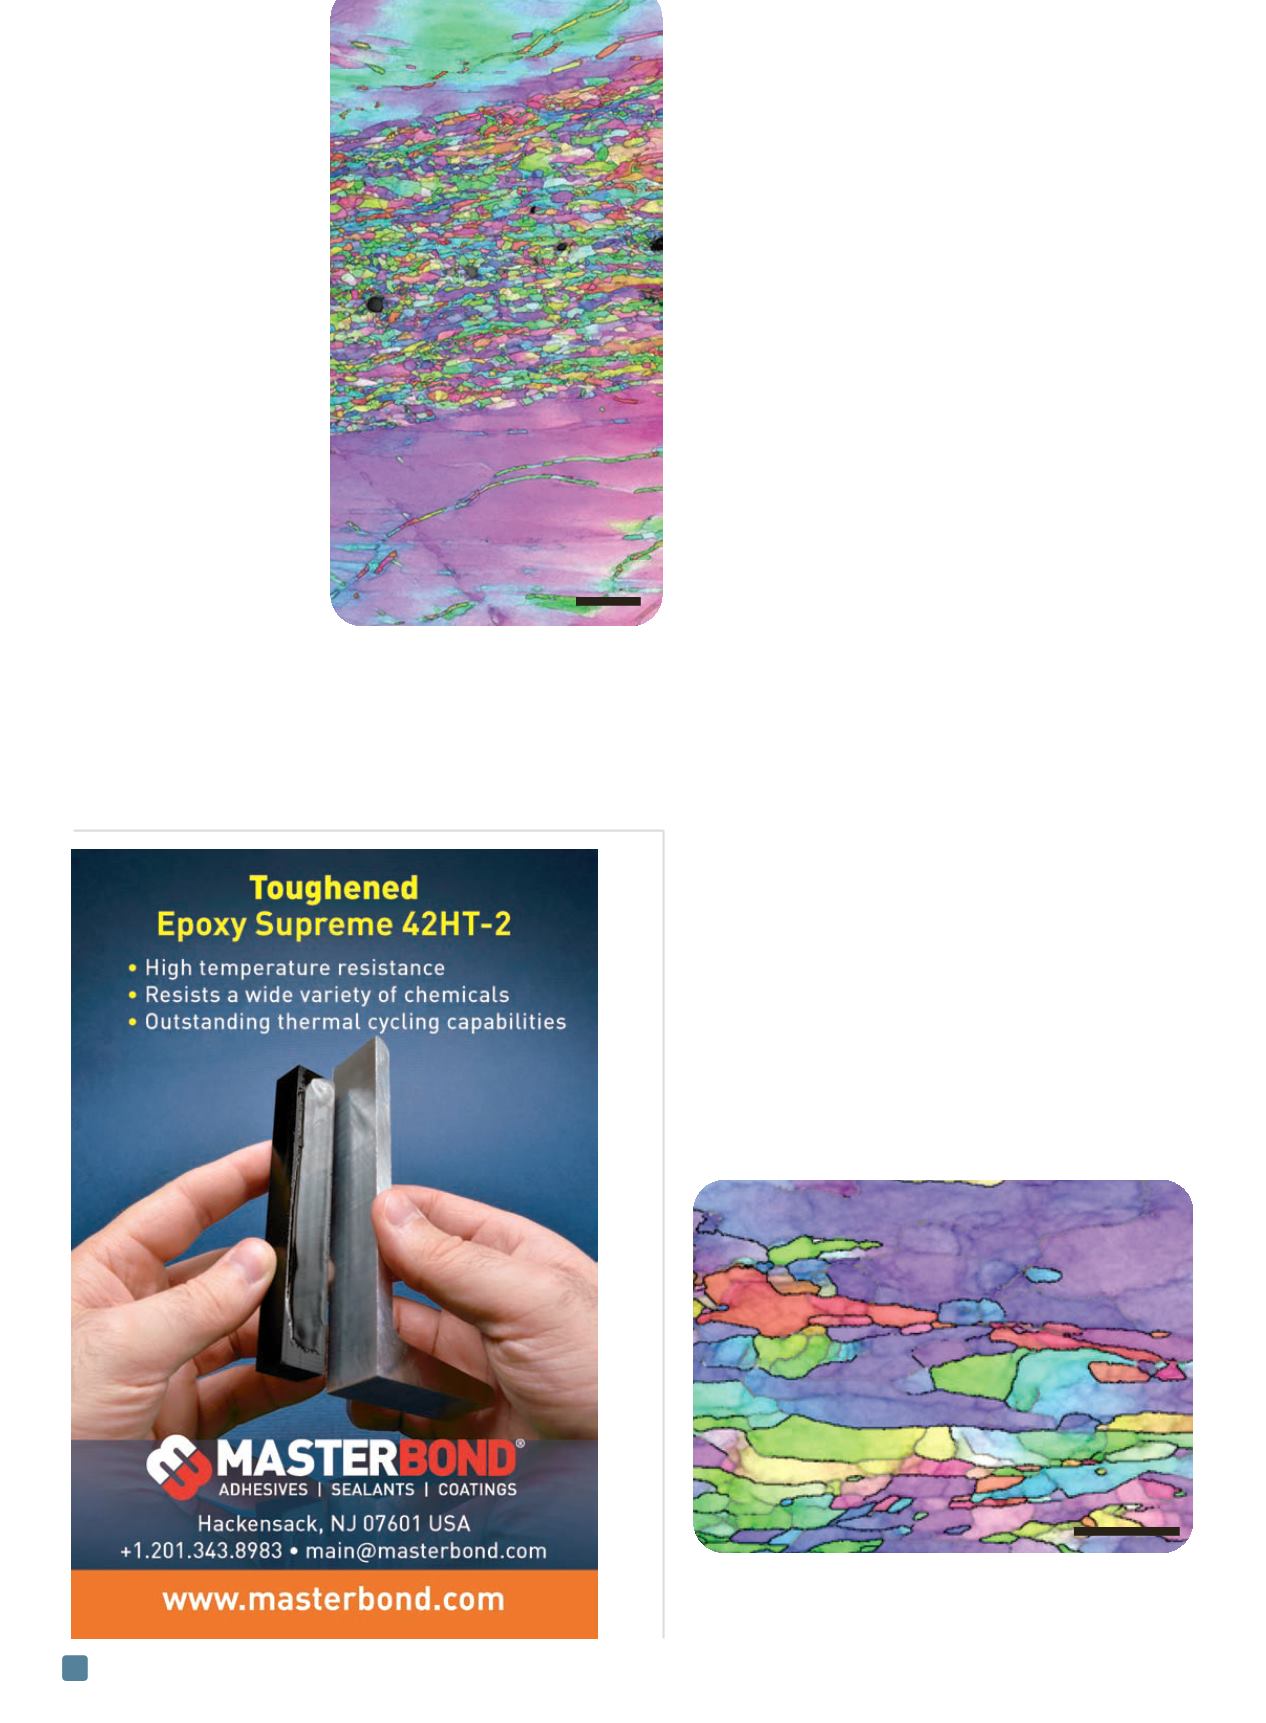
Figure 2 shows a large area (>200 µm
2
) orientation map
from a naturally aged sample collected using TKD, with a
step size of 7.5 nm. Full recrystallization has not taken place,
with large grains at the top and bottom of the analysis area
separated by a broad, nanocrystalline shear band. The large
grains are significantly deformed, with many low angle
ADVANCED MATERIALS & PROCESSES •
FEBRUARY 2014
14
Fig. 2
—
Large
scale TKD
orientation map
showing a
nanocrystalline
shear band
cutting across
coarse grains in a
naturally aged
ECAP-
deformed Al-Mg-
Cu alloy.
2 µm
Fig. 3
—
High resolution TKD orientation map of part of the
shear band shown in Fig. 2. Low angle boundaries (2-10°) are
marked in gray, high angle boundaries (>10°) in black.
500 nm