
iTSSe
TSS
A D V A N C E D
M A T E R I A L S
&
P R O C E S S E S |
N O V E M B E R / D E C E M B E R
2 0 1 6
3 9
FEATURE ARTICLE
7
iTSSe
TSS
coating characterization with progressive removal of layers. A
comparison between the as-sprayed coating and
α
titanium
indicates that no phase transformations take place during
cold spray.
Another example includes characterization of the ab-
sence of decarburization in a WC-Co coating. In Fig. 2(b), a
comparison between the powders and cold spray WC-Co coat-
ing indicates the absence of any decarburization. Moridi, et
al., were able to distinguish between a cold spray coating and
the substrate for a titanium alloy using XRD, and Rokni, et al.,
showed an extensive peak broadening that is typically charac-
teristic of cold sprayed coatings in the as-sprayed condition.
Upon heat treatment, the peaks become sharper, indicative of
stress relaxation in the coatings. In all cases, coating residual
stresses diminish with heat treatment to a more tensile value,
as reflected by a sharpening of the peak, as shown in Fig. 1(a).
Cold spray coatings are nearly always crystalline with
sharp diffraction peaks. X-ray diffraction can identify phase
formation during variations in the process, such as in the
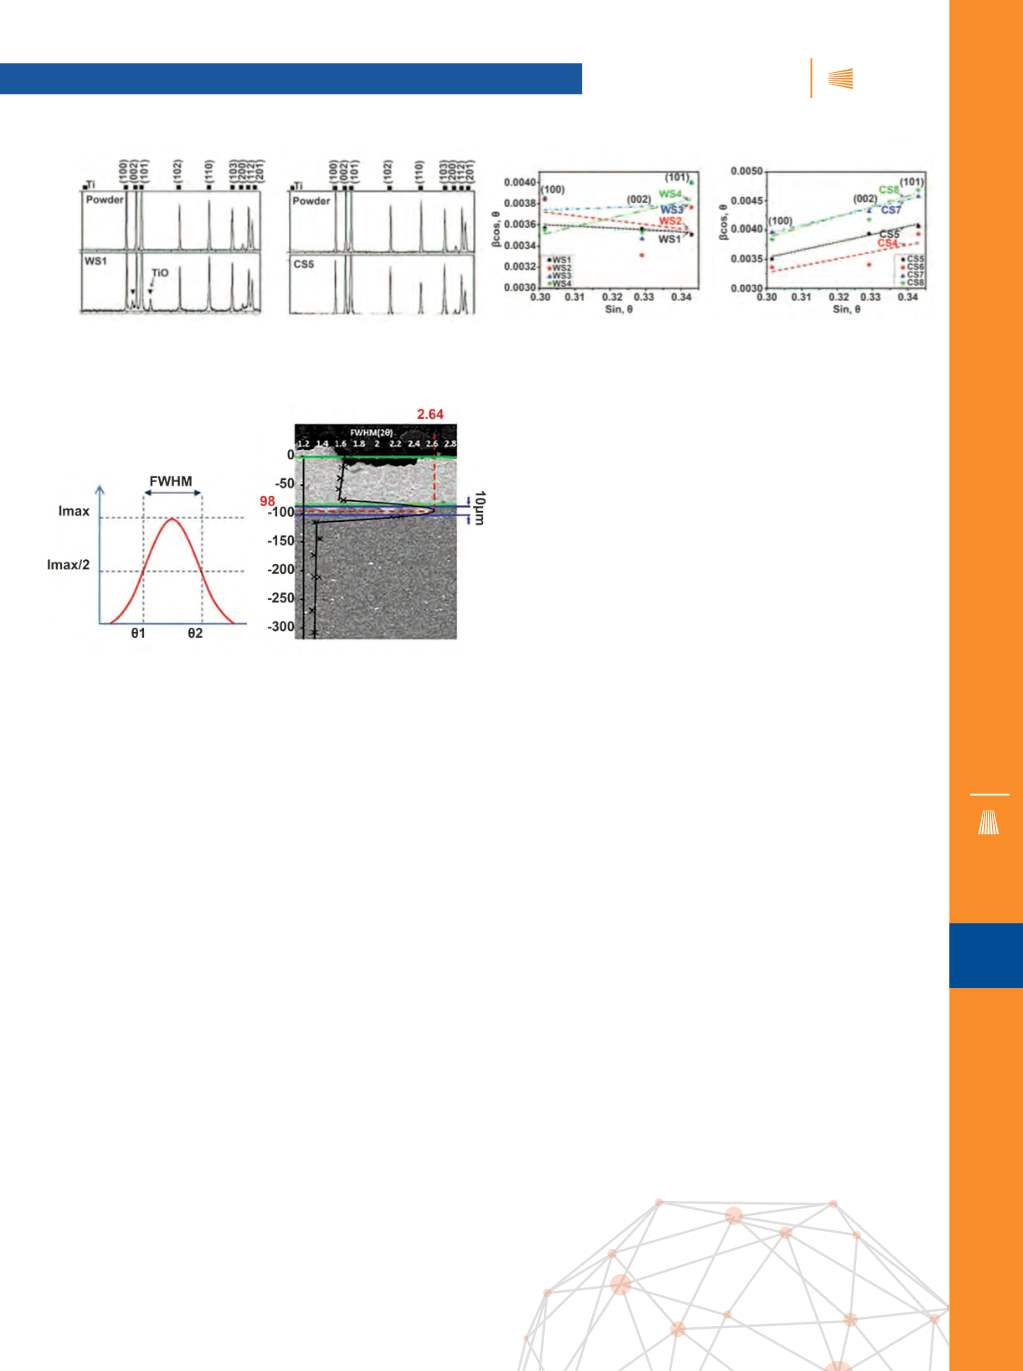
case illustrated in Figs. 3(a) and (b). Kim, et al., have done
extensive characterization of cold spray versus warm spray
using XRD, wherein the presence of oxides of titanium is prev-
alent in the warm-spray coatings, and absent in cold spray.
The authors conclude that solid-state spray can minimize or
eliminate detrimental effects to the microstructure, such as
oxide formation.
Figures 3(b) and (c) compare the WH plots between
warm- and cold-spray titanium, indicating that the coatings
contain more nonuniform strain as compared to the powder.
However, between the two coatings, the cold spray coating
shows a higher level of strain than those in the thermally soft-
ened process of warm spray coatings. Particle sizes indicated
by the WH plots range between 38 and 40 nm.
Peak FWHM is used to interpret the surface state of the
material. Figure 4(a) shows a representative FWHM taken from
the work of Ghelichi and Bagherifard from their studies on an
Al7075 cold spray coating onto an aluminum substrate. A big
jump at the interface between the deposited material and the
substrate is shown in Fig. 4(b), which represents the FWHM
measured through coating thickness into the substrate. In this
case, by applying the de Keijser method, material grain size
ranges between 20 and 50 nm, from a convolution of the dif-
fraction pattern.
Several reports have thus made use of XRD to charac-
terize powders, as-sprayed coatings, extent of lattice strain,
phase transformations in as-sprayed versus heat treated con-
ditions, and grain size. Typically, flat samples are recommend-
ed in order to obtain precise values of lattice spacing from the
x-ray diffractogram. Apart from this, no special care is needed
during sample preparation. The top surface should be slightly
ground off so that any oxides on the surface do not lead to arti-
facts or additional peaks in the XRD pattern.
~iTSSe
For more information:
Dheepa Srinivasan is a principal en-
gineer at GE Power, GE India Technology Center, Bangalore,
dheepa.srinivasan@ge.com,
www.ge.com. This article series is
adapted from
Chapter 5, Cold Spray—Advanced Characteriza-
tion,
in High Pressure Cold Spray—Principles and Applications,
edited by Charles M. Kay and J. Karthikeyan (ASM, 2016).
Fig. 3 —
X-ray diffraction patterns comparing (a) warm spray and (b) cold spray titanium coatings, along with the respective starting powders
indicate the presence of TiO oxides andmetal in the warm spray coating. Williamson-Hall plots for the (c) warm spray and (d) cold spray coat-
ings indicate a lower degree of strain in the warm spray coating.
Fig. 4 —
(a) Full width at half maximum (FWHM) from an x-ray
diffractogrampeak corresponding to a cold spray Al7075 coating.
(b) Mapping the FWHM through coating thickness and substrate to
estimate grain size.
(a)
(b)
(a)
(b)
(c)
(d)


