


 21 / 50

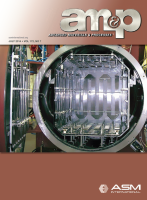
powder (C) was atomized in air. Particle morphology and
size distribution are important considerations in develop-
ing EBM process parameters. Figure 1a shows two distri-
butions for powder A—one separating the satellite
particles from the distribution measurement, and one in-
cluding them in the overall particle diameter. Powder B has
a skewed distribution with small particles, while powder
C shows a bimodal distribution with an average size of
roughly 55 µm. Particles that are too large are not de-
posited by the raking system, while those that are too small
may be charged and scattered by the beam and may also
require special handling and storage considerations. The
relative packing density, as well as the contact area between
particles, can have a significant influence on flowability,
thermal conductivity, and melt pool liquid flow. Apparent
density and volumetric flow rate of the three high-purity
copper powder types, shown in Fig. 1b, were analyzed ac-
cording to ASTM standards B703-10 and B855-06, respec-
tively
[14,15]
. An Arnold meter consistently measured equal
volumes of powder. Flow time (in seconds) of the sample
was then measured using a calibrated Hall flowmeter.
Subsequent microscopic analysis explains some of the
differences in flow times and apparent densities for the dif-
ferent powders. Powder A particles, shown in Fig. 1c, are
irregularly shaped and exhibit a higher flow time than
powder B and C particles, which are nearly spherical. For
particles of relatively equal size, improved flow tends to
come at the cost of reduced packing. For all powder types,
another cause of poor flow characteristics involves small
satellite particles attached to the surface of larger ones.
Microstructural and elemental powder analysis
All powder samples were mounted, ground, polished
(0.03 μm alumina), and etched using a solution of 100 mL
water, 8 mL sulfuric acid, 4 mL sodium chloride, and 2 g
potassium perchlorate. For imaging, a Reichart MF4 A/M
optical metallograph with digital image converter was
used. Polished and etched samples were also observed in a
Hitachi H-8500 field emission SEM. Residual Vickers mi-
croindentation hardness values were measured in a Struers
Doramin A-300 digital test station.
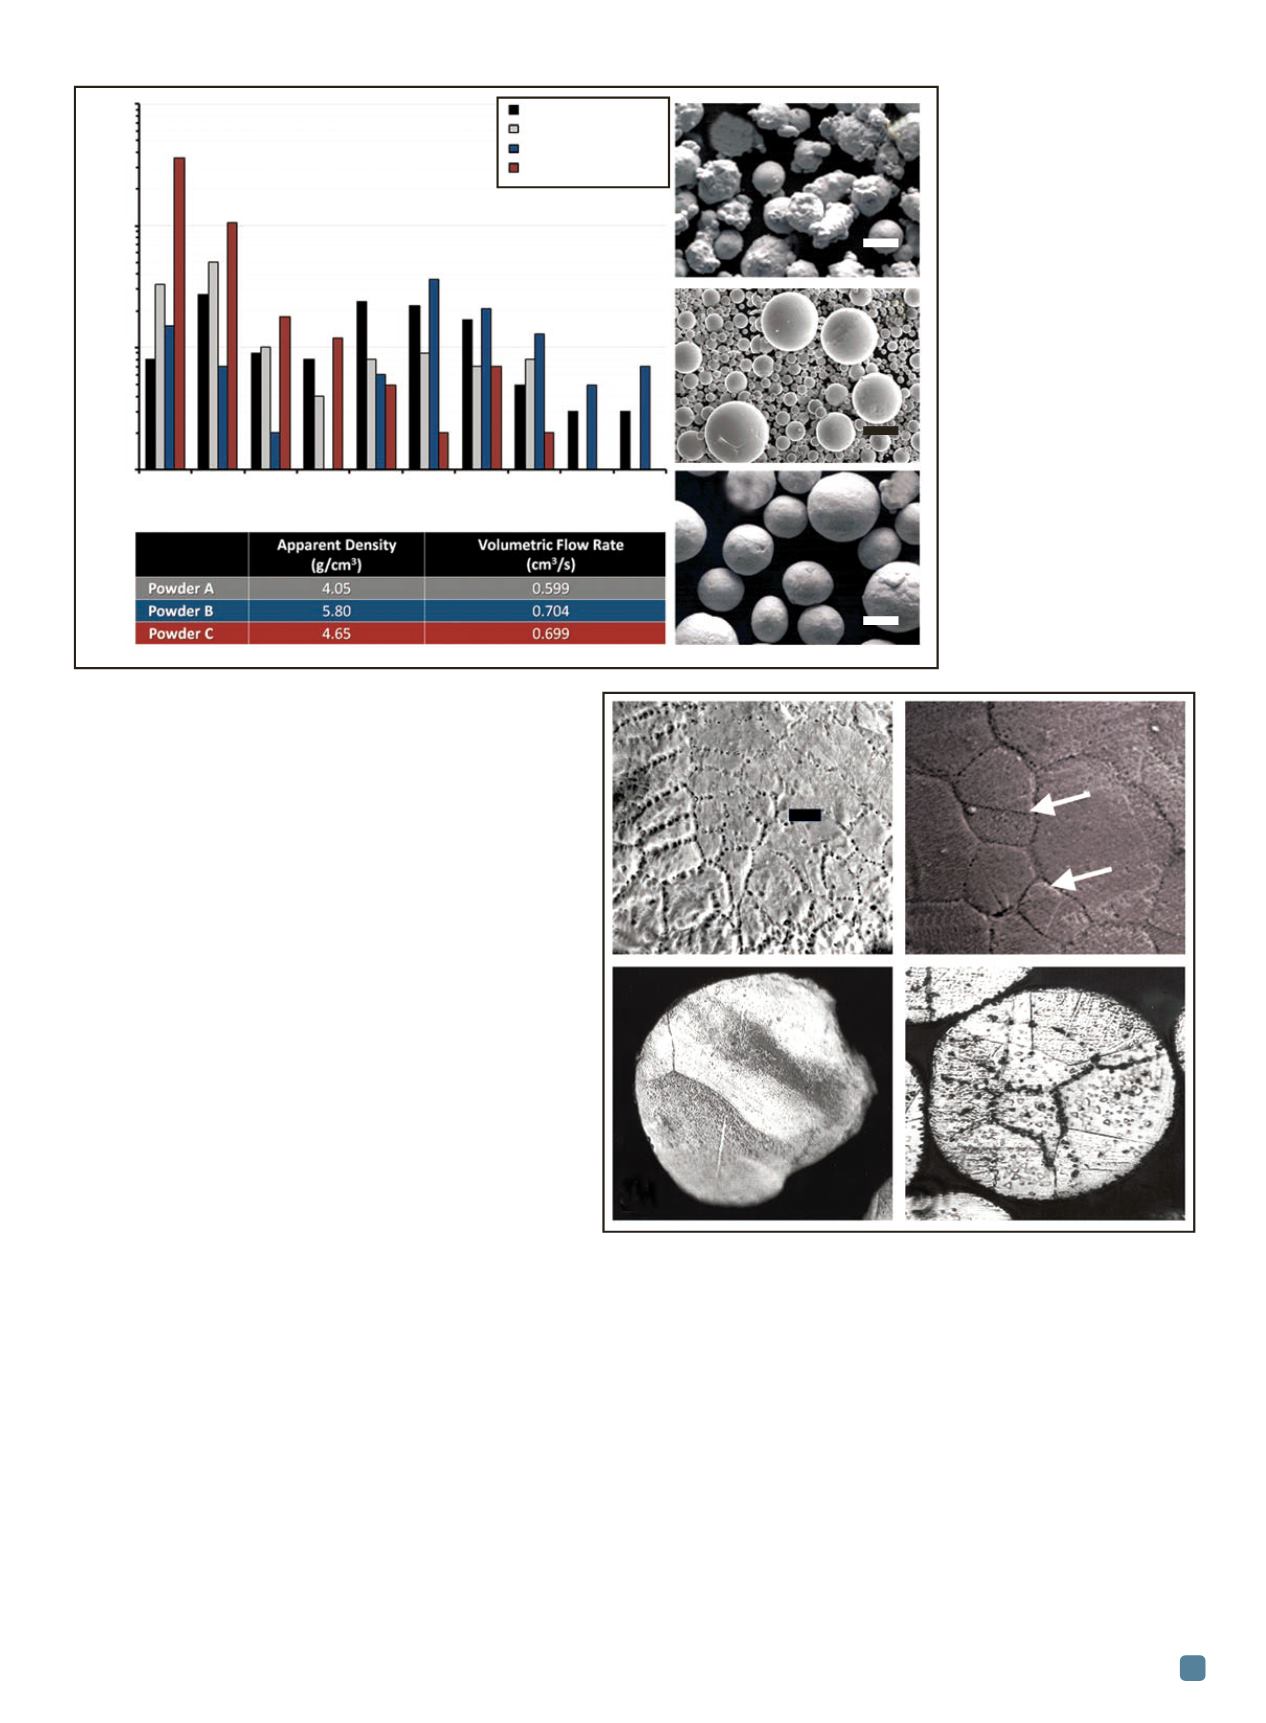
Oxygen content in the powder plays a significant role
in the EBM process. The three powders were analyzed for
oxides and it was found that powders A and C had the
greatest concentration due to the manufacturing processes
used. Figure 2a shows an SEM image of a cross-section for
a powder C particle with small equiaxed grains with no-
ADVANCED MATERIALS & PROCESSES •
JULY 2014
21
Fig. 1
—
Measurements of
particle size distribution for
each powder type (1a).
Table defines average
apparent density and average
volumetric flow time (1b).
Micrographs show shapes of
three different powder
types—powder A (1c),
powder B (1d), and powder
C (1e).
Fig. 2
—
Magnified SEM image of powder C section showing high
concentration of oxides at the grain boundaries (a), and powder B section
showing some oxides at the grain boundaries indicated by arrows (b).
Optical microscopy views of embedded, polished, and etched Cu particles of
powder B, new (c) and used after several EBM build cycles (d), showing a
nearly equiaxed grain structure with increased oxygen in the grain boundaries.
(a)
(b)
(c)
(d)
(e)
1000
100
10
1
Particle count
1-10 11-20 21-30 31-40 41-50 51-60 61-70 71-80 81-90 91-100
Particle size, µm
Particle size distribution
40 µm
40 µm
40 µm
Powder A – Single
Powder A – Bulk
Powder B
Powder C
5 µm
(a) (b)
(c)
(d)