


 34 / 70

structural factors, including wearing through any oxidized
surface layers and adsorbed species, reorientation of ran-
domly oriented lamellae of MoS
2
so that the easily sheared
basal planes are parallel to the sliding direction, and estab-
lishing a transfer film of MoS
2
on the mating surface. This
figure also illustrates that the steady-state friction coeffi-
cient exhibited by MoS
2
films is higher in environments
containing water vapor compared to that in inert atmos-
pheres. This is due to dynamic oxidation and water vapor
effects on the MoS
2
during sliding, which disrupts the easy
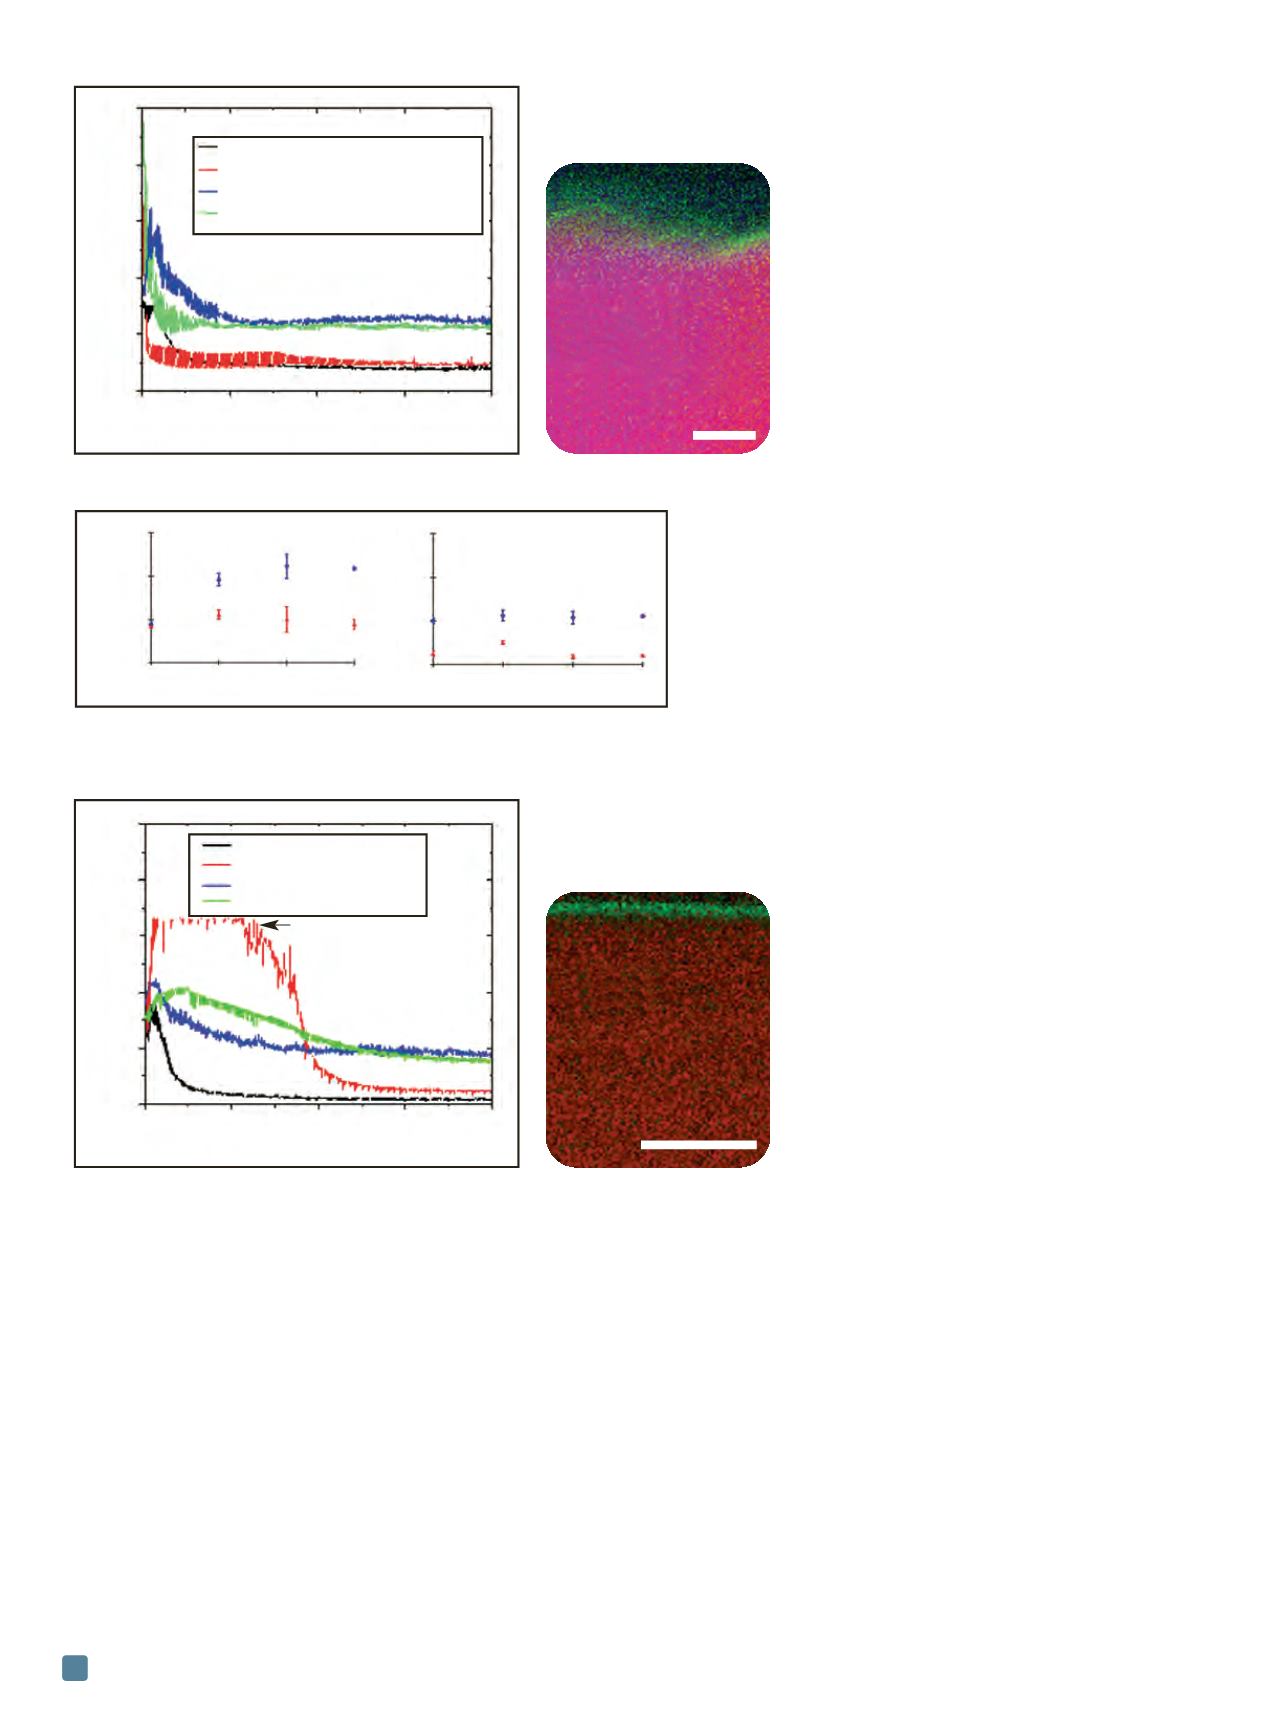
shear between sulfur-terminated basal planes. A cross-sec-
tional energy dispersive x-ray spectroscopy (EDS) map of
this film acquired using a transmission electron micro-
scope is shown in Fig. 5(b), and displays a surface layer of
oxidation and silicon contamination a few nm thick. It is
believed that silicon was deposited on the sur-
faces at some point during sample installation
or orbit, because it was not observed on con-
trol samples. X-ray photoelectron spec-
troscopy of these samples confirms
accumulation of oxidized silicon on the sur-
faces. Silicon contamination was also found on
the EOIM-3 flight-exposed samples due to
proximity to a thermal control blanket during
flight, but was not present on control or
ground exposed samples.
To further illustrate the effect of AO expo-
sure in LEO on tribological behavior of these
films, a large amount of friction coefficient
data for the MoS
2
/Sb
2
O
3
films tested as part of the EOIM-
3 experiment is summarized in Fig. 6. As-deposited films
exhibit essentially no run-in behavior when tested in air,
because the dynamic oxidation effects outweigh those
caused by adsorbed surface species and any thin initial sur-
face oxidized layer due to exposure to desiccated air. When
tested in ultrahigh vacuum, however, run-in behavior is ev-
ident in all exposure conditions. The figure also shows that
the initial friction coefficient is elevated for control as well
as exposed samples. Surface oxide in control samples is pro-
duced by exposure to oxygen and low concentrations of
water vapor during desiccated storage for the mission dura-
tion, while exposed samples develop a surface oxide due to
interaction with AO. However, none of these exposures in-
fluences the steady-state friction coefficient because the sur-
face oxidized layer is easily worn away, exposing
the non-oxidized material beneath.
Surface analysis of EOIM-3 samples using
Auger electron spectroscopy reveals that AO
exposure causes surface depletion of sulfur,
presumably through the creation of volatile
sulfate species. This depletion occurs over a
depth of less than 10 nm. All samples exposed
to AO also exhibit oxidation of the near sur-
face layer to MoO
3
and MoO
2
.
DLN films
In addition to MoS
2
films, DLN films also
were exposed to LEO during MISSE-7. These
films were deposited using plasma-assisted chemical vapor
deposition, and contain amorphous carbon and an inter-
penetrating network of oxidized silicon
[10]
.
Friction behavior of DLN films is shown in Fig. 7(a).
Tests in dry nitrogen demonstrate that while the control
sample also exhibits a short run-in period, the initial run-
in period for the DLN film was increased substantially to
about 80 cycles by the flight exposure environment. After
the surface layer is worn away, the film exhibits a steady-
state friction coefficient of µ < 0.03 in dry nitrogen. The
friction coefficient is higher in 50% relative humidity air,
exhibiting a steady-state value of roughly 0.08, while also
exhibiting elevated friction during a run-in period.
Surface chemical analysis in Fig. 7(b) reveals the cause of
the increased run-in period of the AO-exposed DLN sam-
ADVANCED MATERIALS & PROCESSES •
MAY 2014
34
Fig. 5 —
Friction traces for MoS
2
/Sb
2
O
3
/Au film sliding before and after exposure to LEO
during MISSE-7 (a) and an EDS elemental map of the coating after space flight (b).
(a) (b)
(a)
(b)
Fig. 6 —
Initial (a) and steady-state (b) friction coefficient values for
MoS
2
/Sb
2
O
3
films as a function of exposure conditions during EOIM-3. The
solid symbols correspond to mean, and error bars represent one standard
deviation from at least three tests.
(a) (b)
Fig. 7 —
Friction traces for the DLN film before and after exposure to LEO during
MISSE-7 (a) and an EDS elemental map of the coating after space flight (b).
0
50
100
150
200
Sliding cycles
0.5
0.4
0.3
0.2
0.1
0.0
Friction coefficient
MoS
2
/Sb
2
O
3
/Au control (dry N
2
)
MoS
2
/Sb
2
O
3
/Au exposed (dry N
2
)
MoS
2
/Sb
2
O
3
/Au control (humid air)
MoS
2
/Sb
2
O
3
/Au exposed (humid air)
Green = Si-O
Red = Mo-S-Sb-Au
Blue = Au (coating)
100 nm
0.3
0.2
0.1
0.0
0.3
0.2
0.1
0.0
Initial friction coefficient
Air
UHV
Air
UHV
As-deposited Control
Flight
exposed
Ground
exposed
As-deposited Control
Flight
exposed
Ground
exposed
Steady-state friction
coefficient
0
50
100
150
200
Sliding cycles
0.5
0.4
0.3
0.2
0.1
0.0
Friction coefficient
DLN control (dry N
2
)
DLN exposed (dry N
2
)
DLN control (humid air)
DLN exposed (humid air)
Maximum limit of load cell
Green = Si-O-F
Red = C-Si (coating)
50 nm