


 25 / 58

edfas.org
25
ELECTRONIC DEVICE FAILURE ANALYSIS | VOLUME 19 NO. 2
measured from isolated regions and plotted ormapped in
twodimensions, and 3-D isoconcentration surfaces canbe
highlighted. Examples of each of these forms of analysis
will be used to examine these FinFET structures.
Atomprobe tomography provides a unique capability
to examine a structure frommultiple perspectiveswithout
the need to prepare an additional sample or perform a
secondary analysis. Figure 4 shows two different perspec-
tives of the reconstructed tip: perpendicular to the fin
axis (Fig. 4a) and top-down or plan view (Fig. 4b). Each
image is a slice into the reconstruction, revealing buried
features to more clearly show the desired structures.
Three-dimensional isoconcentration surfaces of silicon,
germanium, and the gate oxide are highlighted. These iso-
concentration surfaces highlight a 3-D surface or “shell” of
a given concentration, where everything containedwithin
the bounds of that “shell” has a concentration equal to or
greater than the highlighted surface. The isoconcentration
surfaces for silicon and germanium show the 3-D shape
and texture of these layers/structures. The SiGe source/
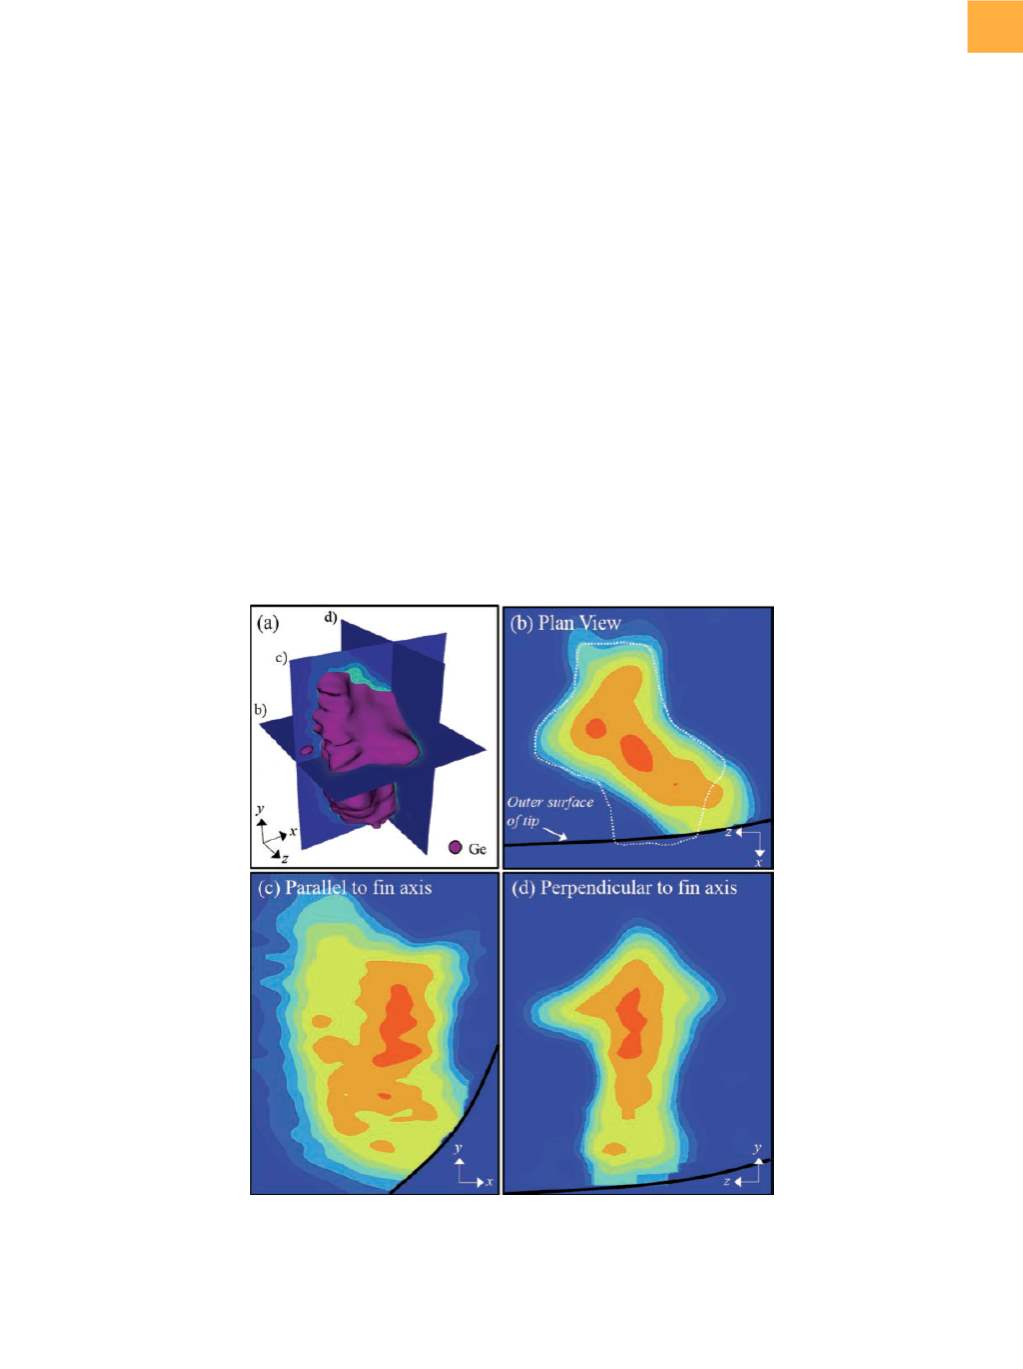
Fig. 5
(a) A 3-D reconstruction of the SiGe source/drain region only, with a germanium isoconcentration highlighted to show the
shape of the SiGe. (b) to (d) 2-D germanium concentrationmaps plotted from slices through the SiGe region at locations
indicated in (a). Concentration and length scales not shown for proprietary reasons. The black solid line in (b) to (d)
indicates the location of the outer surface of the APT tip. The dashed white line in (b) highlights the shape of the SiGe
region from a plan-view perspective.
drain regions are clearly seen in Fig. 4(a) highlighted by
a germanium isoconcentration surface. In Fig. 4(b), the
transition of the fin from SiGe to silicon can be observed
from above as the fin passes under the gate spacer and
subsequently under the polysilicon gate.
THE POWER OF 3-D ANALYSIS
The true power of 3-DAPT is demonstrated by combin-
ing structural and chemical analysis of the buried fins.
Figure 5(a) shows a 3-D view of the center source/drain
SiGe shown in Fig. 4(a) and includes two-dimensional
(2-D) germanium concentration maps taken at slices
through the SiGe parallel to each axis. Thesemaps provide
detailed information about the 3-D germanium distribu-
tion within the SiGe as well as the complex nature of the
SiGe shape. From Fig. 4(a) and 5(d), the top half of the
SiGe appears diamond shaped. In Fig. 5(a), the 3-D SiGe
shape can be seen more clearly, revealing faceting along
the
x
-axis as well as
z
, which creates a conical protrusion
in the
z
-direction. This faceting is also observed from the