



 23 / 58

edfas.org
23
ELECTRONIC DEVICE FAILURE ANALYSIS | VOLUME 19 NO. 2
and should have awell-defined, uniformshank angle and
smooth sides.
APT DATA COLLECTION AND
RECONSTRUCTION
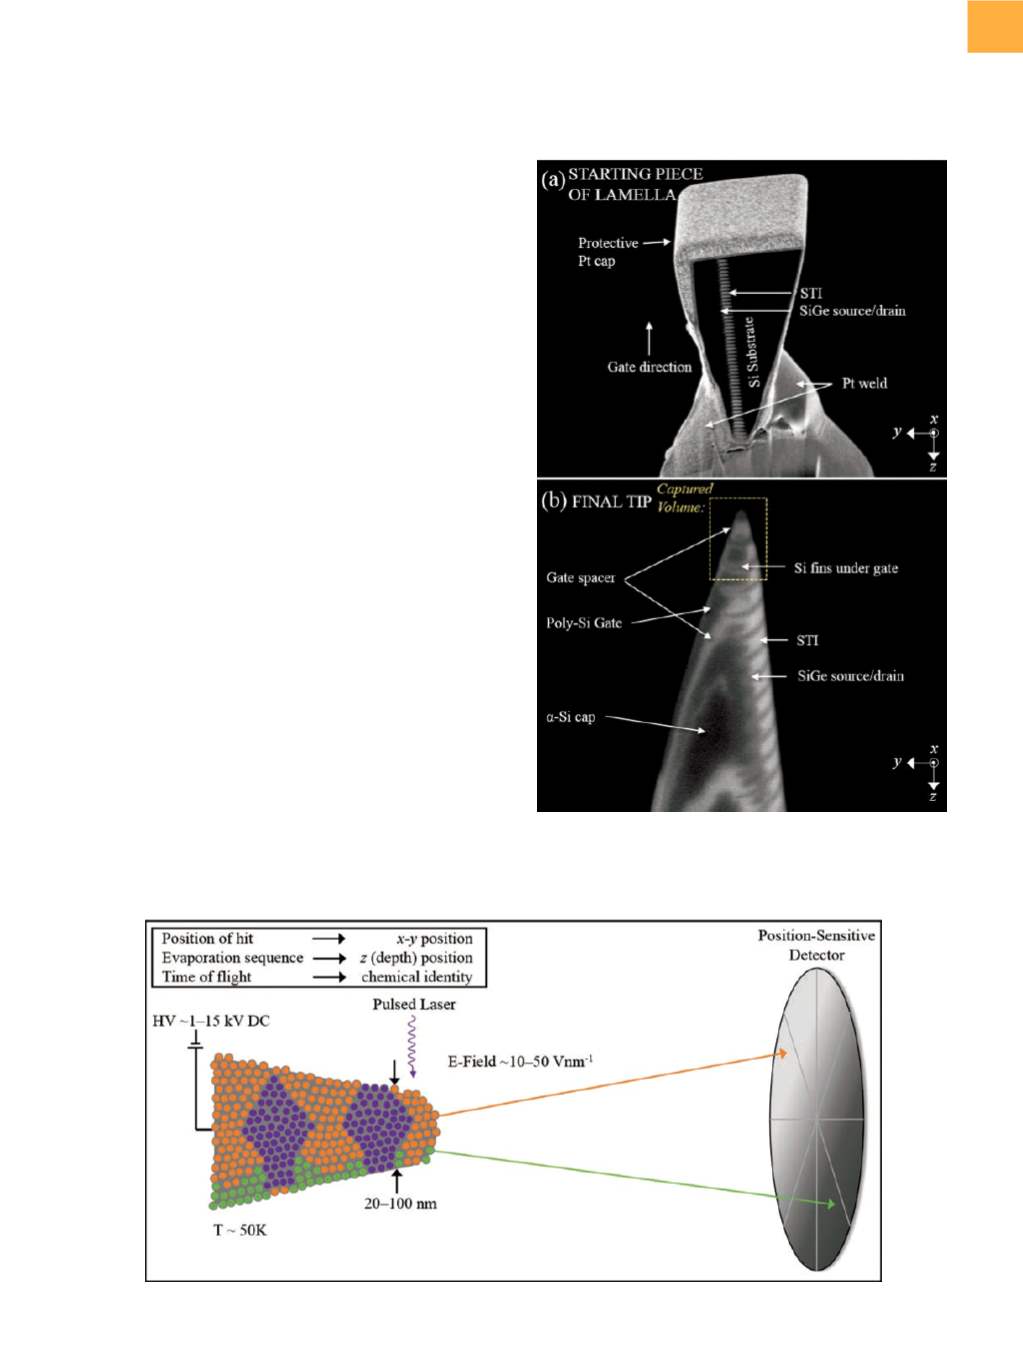
Figure 2 shows a schematic of the basic components
of the atom probe used in this study. Field evaporation
of atoms from the APT tip is achieved by subjecting the
tip to a high direct-current voltage (typically beginning at
approximately 0.5 kV), which produces a high field at the
tip, just below the threshold necessary for field evapo-
ration. Either an additional pulsed voltage or a pulsed
laser (10 to 1000 kHz) is used to increase the field above
the threshold necessary for field evaporation with each
pulse, typically producing a field at the tip of up to several
Vnm
−
1
.
[13]
Field-evaporated atoms are collected by a posi-
tion-sensitive detector used to determine their original
position on the tip, and time-of-flight information taken
fromthe pulsednature of the evaporation is used to deter-
mine the compositionof each collected species (elemental
andmolecular). The number of collected atoms depends
on the size of the area of interest and can range froma few
tens of thousands to hundreds of millions of atoms, with
detector efficiency ranging from30%up to 80%, depend-
ingon the specific atomprobeusedand thematerial being
evaporated. A spectrum of total counts as a function of
mass-to-charge-state ratio provides information about
the total number, isotopes, and ionization state of each
evaporated species.
To reconstruct the captured volume in 3-D, the collect-
eddata are fed into analgorithm, which, in essence, pieces
Humpty Dumpty back together again. A magnification
transformation (for
x
and
y
) and a depth transformation
(for
z
) are used in conjunction with an assumed hemi-
spherical cap-on-a-cone tip shape with some defined
shank angle.
[14,15]
A few parameters can be fine-tuned to
Fig. 2
Schematic of the basic components of the atom probe as used in the study presented
Fig. 1
Scanning electron microscope images of (a) the
starting piece of the lamella prior to APT tip shaping
and (b) the final tip. Scale bars not shown for
proprietary reasons