


 24 / 58

edfas.org
ELECTRONIC DEVICE FAILURE ANALYSIS | VOLUME 19 NO. 2
24
increase reconstruction accuracy (e.g., inputting a mea-
sured shank angle fromhigh-resolution scanning electron
microscope, or SEM, images; measurements of tip diam-
eter at specific features). Once an accurate reconstruction
is achieved, the sample is ready for 3-D analysis.
CASE STUDY: EPITAXIAL SiGe PROFILE
AND DOPANT DISTRIBUTION FOR
SOURCE/DRAIN FinFET DEVICE
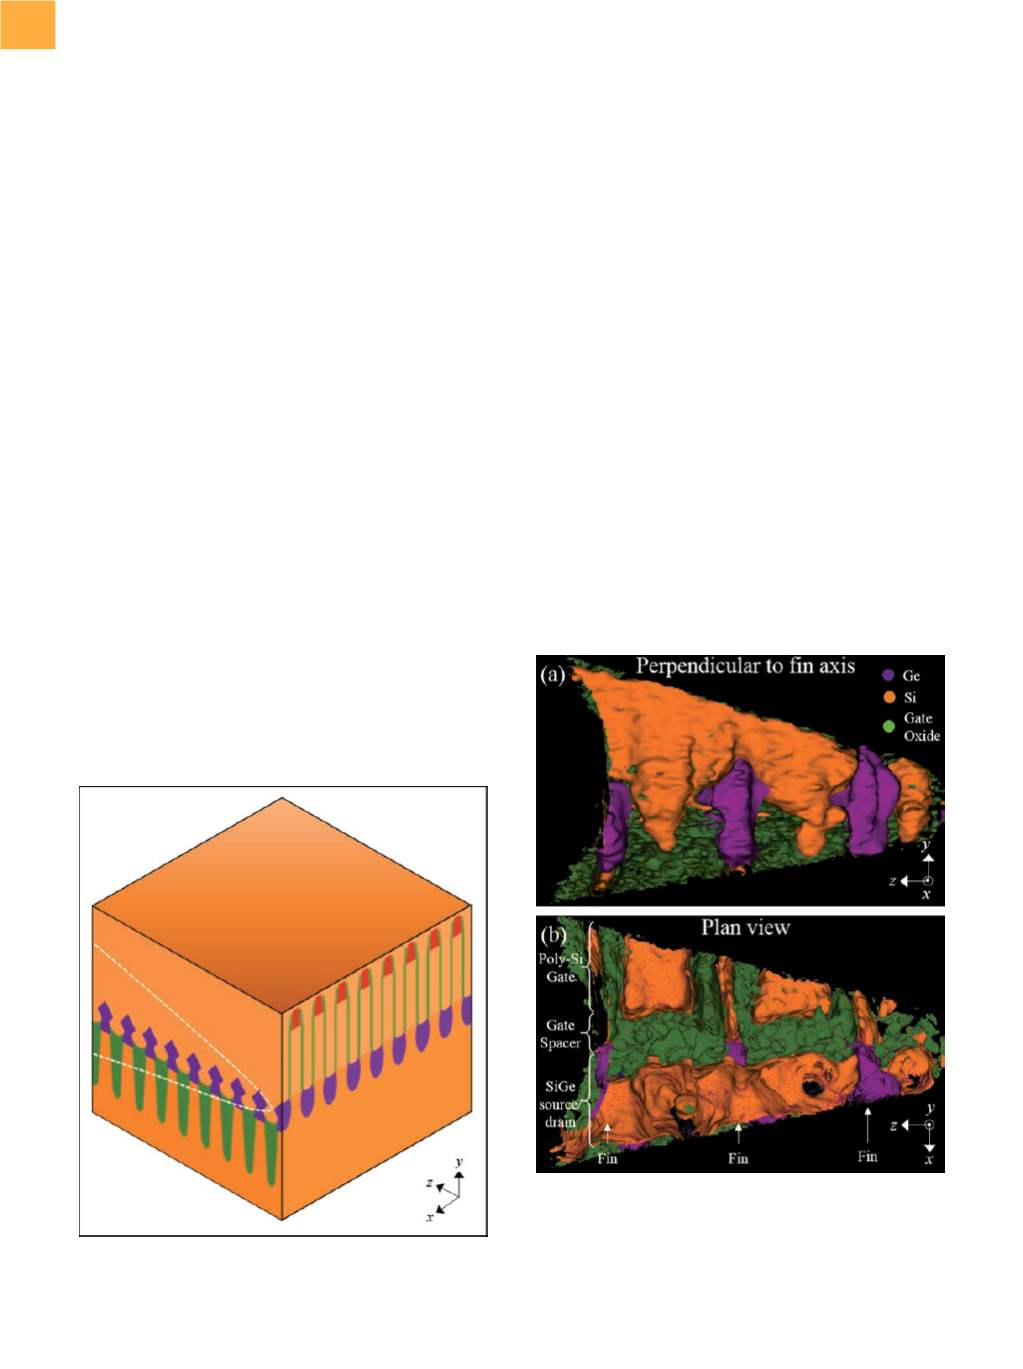
The complex 3-D structure of state-of-the-art FinFETs,
as shown in the schematic in Fig. 3, presents challenges
for a number of characterization techniques. This study
examines the use of 3-D APT to reveal structural and com-
positional characteristics of the SiGe source/drain region
of the FinFET as well as light dopant profiles throughout
the SiGe. The structure examined in this study consists of a
specially designed array of fins andpolysilicon (“dummy”)
gates, each with known pitch and length on the order of
microns. Sample preparation was done following the
cross-section preparation method demonstrated in Ref
1, which involves rotating the lamella 90° after liftout,
such that the gates run parallel to the
z
-axis of the APT
tip, with rows of fins running perpendicular to the tip in
the
x
-direction, as shown in Fig. 1.
Field evaporation of the tip was done in a Cameca
FlexTAP 3-D atom probe at 50 K under ultrahigh vacuum
conditions (~3
×
10
−
11
torr) using an ultraviolet laser
with starting energy of 35 nJ (spot size ~20 µm), which
was slowly decreased throughout field evaporation as
the voltage increased to maintain a Si
++
:Si
+
ratio of
approximately 10:1. The atom probe was operated at the
maximum field of view of 30° to increase the captured
cross section of the tip. The volume indicated in Fig.
1(b) was evaporated and collected. The collected atoms
were reconstructed using the Integrated Visualization
and Analysis Software package, which reconstructs the
original tip with the capability of performing 3-D analysis
not only of the tip surface visible in the SEM but of buried
features as well.
A FIRST LOOK AT THE
RECONSTRUCTED TIP
In the reconstructed volume, each collected element,
molecule, and/or isotope (including various ionization
states) can be shown in a different color and displayed or
hidden from view as desired, to more clearly analyze dif-
ferent features. Furthermore, “cuts” can bemade into the
reconstruction at any location and orientation to reveal
buried features, concentrations of various species can be
Fig. 3
Schematic of the device structure analyzed by APT in
this study. The dashed white line shows the position
of the atom probe tip.
Fig. 4
A 3-D APT reconstruction of the tip shown from (a)
perpendicular to the fins perspective and (b) plan
view (top-down perspective). Silicon, germanium,
andthegateoxidearehighlightedbyisoconcentration
surfaces of different colors as indicated in (a). Scale
bars not shown for proprietary reasons