


 12 / 58

edfas.org
ELECTRONIC DEVICE FAILURE ANALYSIS | VOLUME 18 NO. 3
12
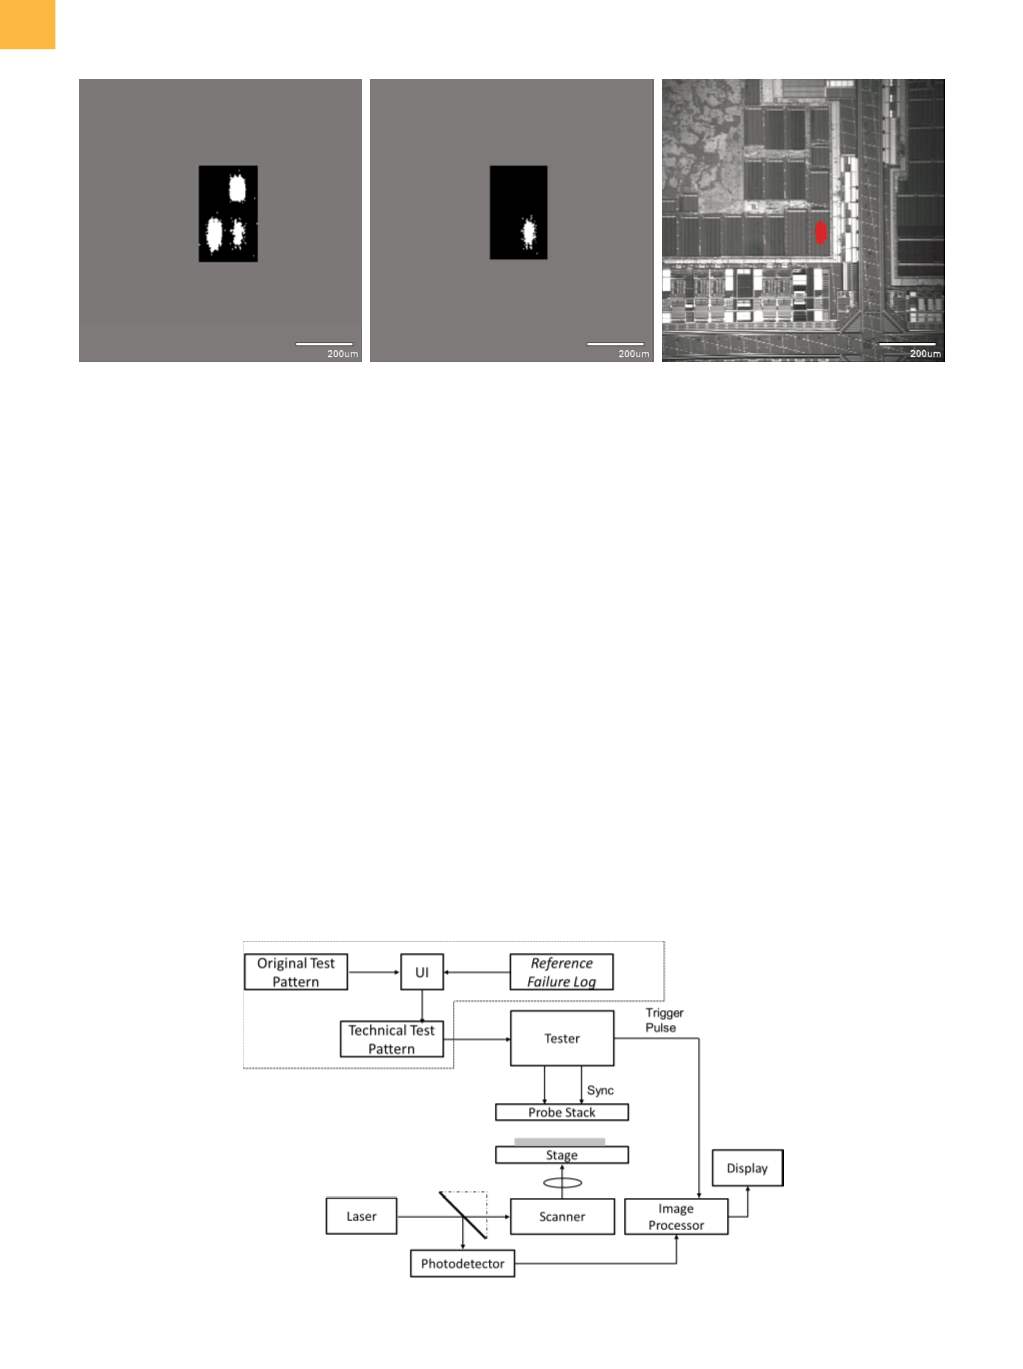
with the rest “electrically filtered.” Figure 4(c) shows the
overlay image. This result demonstrates the feasibility of
the technology.
Additionally, it should be noted that the criteria for
matching can be determined by the user. For example, a
trigger pulse can also be generated as long as one of the
current fail vectors matches to any of the failed vectors
in the reference signature. In this case, more signals are
expected to be observed in the image as compared to
an exact match, because the comparison scheme is less
stringent.
SOFTWARE APPROACH
Another approach to realize EeLADA is illustrated by
the block diagram in Fig. 5. Unlike the hardware approach,
there is no comparator logic involved to assess a match
situation. Instead, a graphical user interface (GUI) receives
the original test vectors as well as details of the failing
signature to generate a technical test pattern dedicated
for defect localization. To explain the methodology,
consider a simple case of a failure signature consisting
of only a failed vector that corresponds to a certain fail
cycle and pin. Assuming this specific compare vector is
failing, a “High” is expected; that is, it attains a “Low” on
the test. The original vectors that correspond to the failing
signature are inverted. In this case, instead of expecting
a “High,” the test now expects a “Low” for this compare
vector to pass. Therefore, the test will fail by default when
the technical test pattern is employed. As the laser induces
LADA signals that give rise to failing compare vectors
other than the inverted vector, the test state remains
unchanged. Conversely, when the LADA signal matches
the failing signature, there is a state change to pass, and a
match trigger signal is provided directly from the tester to
the image processor. Similar to the hardware implemen-
tation, the match criteria are, in fact, controllable. In this
approach, they are determined by the way the original
pattern is manipulated to produce the technical pattern.
Figure 6 shows a screenshot of the GUI dashboard. The UI
enables a user toprovide inputs tomanipulate the original
(a)
(b)
(c)
Fig. 4
(a) Conventional LADA signals. (b) EeLADA signals. (c) Overlay image
Fig. 5
Block diagram representing software implementation of EeLADA