


 14 / 58

edfas.org
ELECTRONIC DEVICE FAILURE ANALYSIS | VOLUME 18 NO. 3
14
(a)
(b)
Figure 7 presents a matrix defining the different
variants of compare vector manipulation and their cor-
responding stringency. As an illustration, Fig. 8(a) and
(b) show the case of the most- and least-stringent sce-
narios, respectively. The compare vectors highlighted in
red are failing on a bad IC. Following the most-stringent
match criteria, all these compare vectors are inverted in
the technical pattern. This is the case described in the
beginning of this section. To demonstrate the method-
ology, the same experiment that was performed earlier
following the hardware approach is repeated, but this
time applying the software approach. The EeLADA
signals obtained are similar to Fig. 4(b). This validates
the method.
Consider the least-stringent case next, using another
experiment based on some random logic of an IC. The
compare vectors are masked in the technical pattern
according to a failed IC’s failure signature, and the EeLADA
signals acquired on a passing IC are shown in Fig. 9(b).
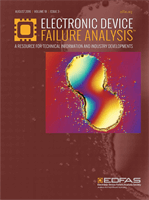
Figure 9(a) shows the conventional LADA signals (pass-
to-fail state transition) acquired using the original test
pattern for comparison. Some signals appear tobemissing
Fig. 9
(a) Conventional LADA signals. (b) EeLADA based on
least-stringent technical test pattern
(a)
(b)
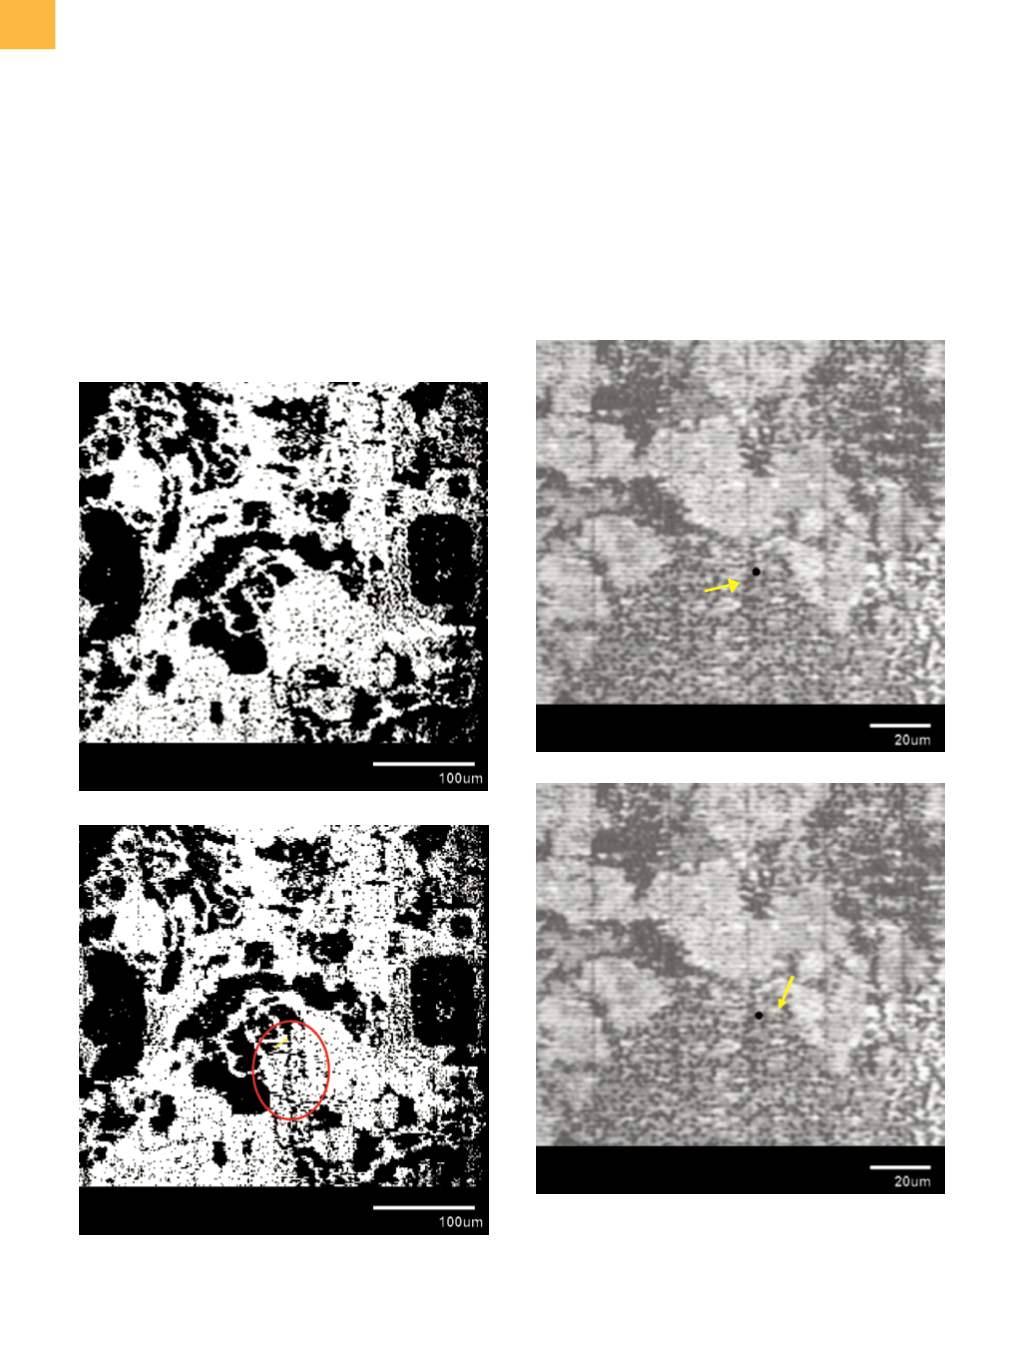
Fig. 10
EeLADA signal overlay images based on (a) first
fail cycle and (b) last fail cycle invert technical test
pattern. The black dot denotes the location of a
programmed defect. Arrow points to signal.