


 22 / 54

A D V A N C E D M A T E R I A L S & P R O C E S S E S | J A N U A R Y 2 0 1 7
2 2
The strength and hardness of the
structure are mainly due to the volume
fraction of the ferritic phase (V
α
), while
plate thickness is responsible for further
strengthening. Accordingly, hardness
and yield strength values correlate well
with the ratio V
α
/t as shown in Table 1.
Strength residue—after accounting for
bainitic-ferrite plate thickness—comes
from dislocation forests, the intrinsic
strength of the iron lattice, and solution
strengthening
[1]
. Therefore, at the same
transformation temperature, higher
carbon grades (1.0 C and 0.8 C) exhibit
superior tensile properties, with UTS
values greater than 2 GPa.
Microstructural parameters in
terms of phase volume and scale fail to
predict elongation values. For instance,
ductility at the lowest transformation
temperature is relatively low for all
compositions. However, sensitive and
unsystematic improvement occurs when
transforming at 250°C despite the fact
that microstructural parameters do not
significantly change. Retained austenite
mechanical stability might be the key to
the ductility in those microstructures
[6]
.
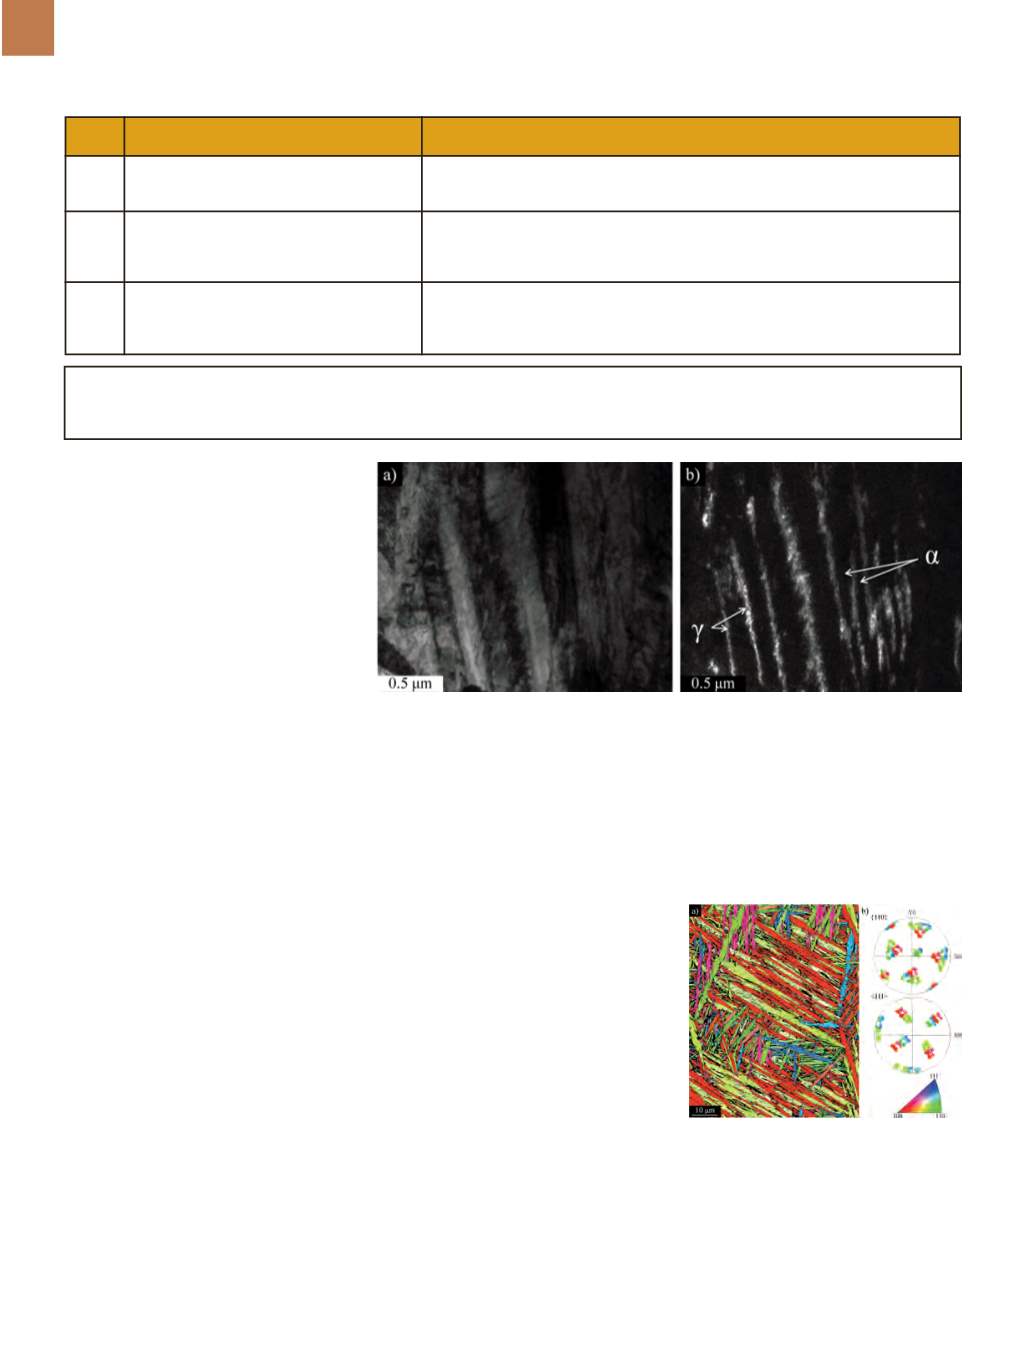
NANOSCALE FERRITE
Transmission electron microscopy
(TEM) micrographs of 0.6 C steel trans-
formed at 220°C for 22 hours are shown
in Fig. 2. Some bainitic ferrite plates are
exceptionally long and thin (~50 nm),
with a structure consisting of an inti-
mate mixture of ferrite and austenite
(Fig. 2).
Nearly all ferrite laths in a bainite
sheave have the same crystallographic
orientation. In displacive transforma-
tions, it is generally assumed that the
close-packed {111} plane of austenite
(face-centered cubic, or fcc) is parallel
to a {110} plane of the bainitic ferrite
(body-centered cubic, or bcc). In nano-
bainitic steels, most bainitic plates
and parent austenite interfaces have
an orientation relationship (OR) close
to the Nishiyama–Wassermann (N-W),
{111}γ||{110}α with <110>γ||<001>α
[7]
.
From a single austenite crystal, 12 crys-
tallographic variants can be formed
with an N–W orientation relationship
due to the symmetry of cubic systems.
A crystallographic packet is a group of
crystallographic variants with a com-
mon {111} austenite plane. Each bain-
itic packet can be divided into bainitic
blocks of the three variants of the N–W
relationship satisfying the same paral-
lel plane relationship. This causes the
obtained microstructure to be highly
misoriented, with a wide variety of
microstructural barriers.
ID
Chemical composition, wt%
T ,°C Time, h
V
γ
, % t,
nm
V
α
/t,
Hardness,
nm
-1
HV30
1.0 C
1.00 C, 2.90 Si, 0.75 Mn, 0.50 Cr
220
22
36
28
2.29
650
250
16
34
39
1.69
625
220
22
22
32
2.44
710
0.8 C
0.88 C, 1.54 Si, 0.69 Mn, 0.50 Cr
250
16
18
38
2.16
659
270
7
24
36
2.11
615
0.6 C
0.65 C, 1.60 Si, –1.25 Mn, 1.60 Si, 1.75 Cr,
220
22
24
38
2.00
643
0.15 Mo, 0.12 V
250
15
22
37
2.11
600
270
7
32
48
1.44
554
KEY
T: transformation temperature; Time: transformation time;
V
γ
volume fraction of austenite;
t
: bainitic ferrite plate thickness;
V
α
/t
, ratio
between the volume fraction of bainitic ferrite and the plate thickness.
Fig. 2
—
TEM of microstructures obtained at 220°C for 22 h in 0.6 C steel. a) Bright-field image.
b) Corresponding dark-field image of retained austenite films where bainitic ferrite plates lie
between.
Fig. 3
—
a) Inverse pole including a single
prior austenite grain of 0.6 C steel trans-
formed to bainite at 270°C for 7 h. The black
thin lines represent either misorientation
angles greater than 10° or austenite films. b)
{011} and <111> pole figures representing all
orientations of bainite laths corresponding
to (a), showing the typical N-W pattern.
TABLE 1 —SECONDGENERATIONBAINITIC STEEL NANOSTRUCTURE PROPERTIES