


 20 / 78

A D V A N C E D M A T E R I A L S & P R O C E S S E S | J U N E 2 0 1 6
2 0
EXPERIMENTAL METHOD
The ZE20 alloy features a mea-
sured composition of Mg-1.9Zn-0.2Ce
(wt%). The alloy was first gravity cast,
and then rolled at 673 K. For the in-situ
annealing experiments, flat rectangu-
lar samples with ~10 mm width and
~15 mm length were cut from the
as-rolled sheets (~1.3 mm thick) using
a diamond saw. Samples were mechan-
ically polished using silicon carbide
grinding papers. To further improve
sample surface quality for EBSD, spec-
imens were electropolished using a
solution of 30% nitric acid and 70%
methanol as an electrolyte and a Stru-
ers TenuPol-5 double jet system.
Figure 1 shows the experimental
setup used for the in-situ annealing
experiments. A 6-mm-diameter tung-
sten heating element (connected to a
constant-voltage power supply) was
mechanically fixed to a customized
metallic platform to control sample
temperature. The sample was placed
directly on top of the heater and
secured using copper tape. The plat-
form was then mechanically attached
to a Tescan Mira3 SEM stage. Tempera-
ture was monitored using a fine gage
K-type thermocouple spot welded to
the specimen. Inside the SEM cham-
ber, vacuum was maintained below
2x10
-6
torr throughout the experiments.
An EBSD orientation map of a
~100 × 100 µm microstructural patch
was initially acquired at 298 K using
EDAX TSL OIM Data Collection v6.1 soft-
ware. The specimen was heated to a
target temperature (423 K) and held for
~15 minutes to homogenize and stabi-
lize temperature. An EBSD map of the
same microstructural patch was then
acquired while the sample was held
at the desired temperature. A step size
of 0.5 µm was used. The EBSD orien-
tation map was typically acquired in
~45 minutes. No significant microstruc-
ture change was observed during this
time. Specimen temperature was main-
tained within ±3 degrees of the target
while the EBSD maps were acquired.
The heating and subsequent EBSD
mapping cycle was then continued up
to a desired temperature. EBSD maps
were acquired at 298 K, 423 K, and at
473 to 598 K with 25° increments. It
took approximately 10 minutes to heat
the sample to a temperature 25° higher.
EBSD data was analyzed using
EDAX TSL OIM Analysis v6.1 software.
Post-processing clean-up procedures of
the raw data removed erroneous data
points formed due to un-indexed or
inappropriately indexed patterns. Input
parameters for clean-up procedures
were selected based on an overall aver-
age confidence index value of the raw
data in an effort to minimize the num-
ber of points modified. For the maps
taken at temperatures below 523 K,
~20-25% of the total points were mod-
ified during the clean-up procedure.
For maps taken at temperatures above
523 K, ~15% of the total points were
modified during the same clean-up
procedure. Thus, the quality of EBSD
indexing increased with an increase in
temperature as the microstructure con-
sisted mainly of newly recrystallized,
relatively strain-free grains.
MICROSTRUCTURE
EVOLUTION IN ZE20
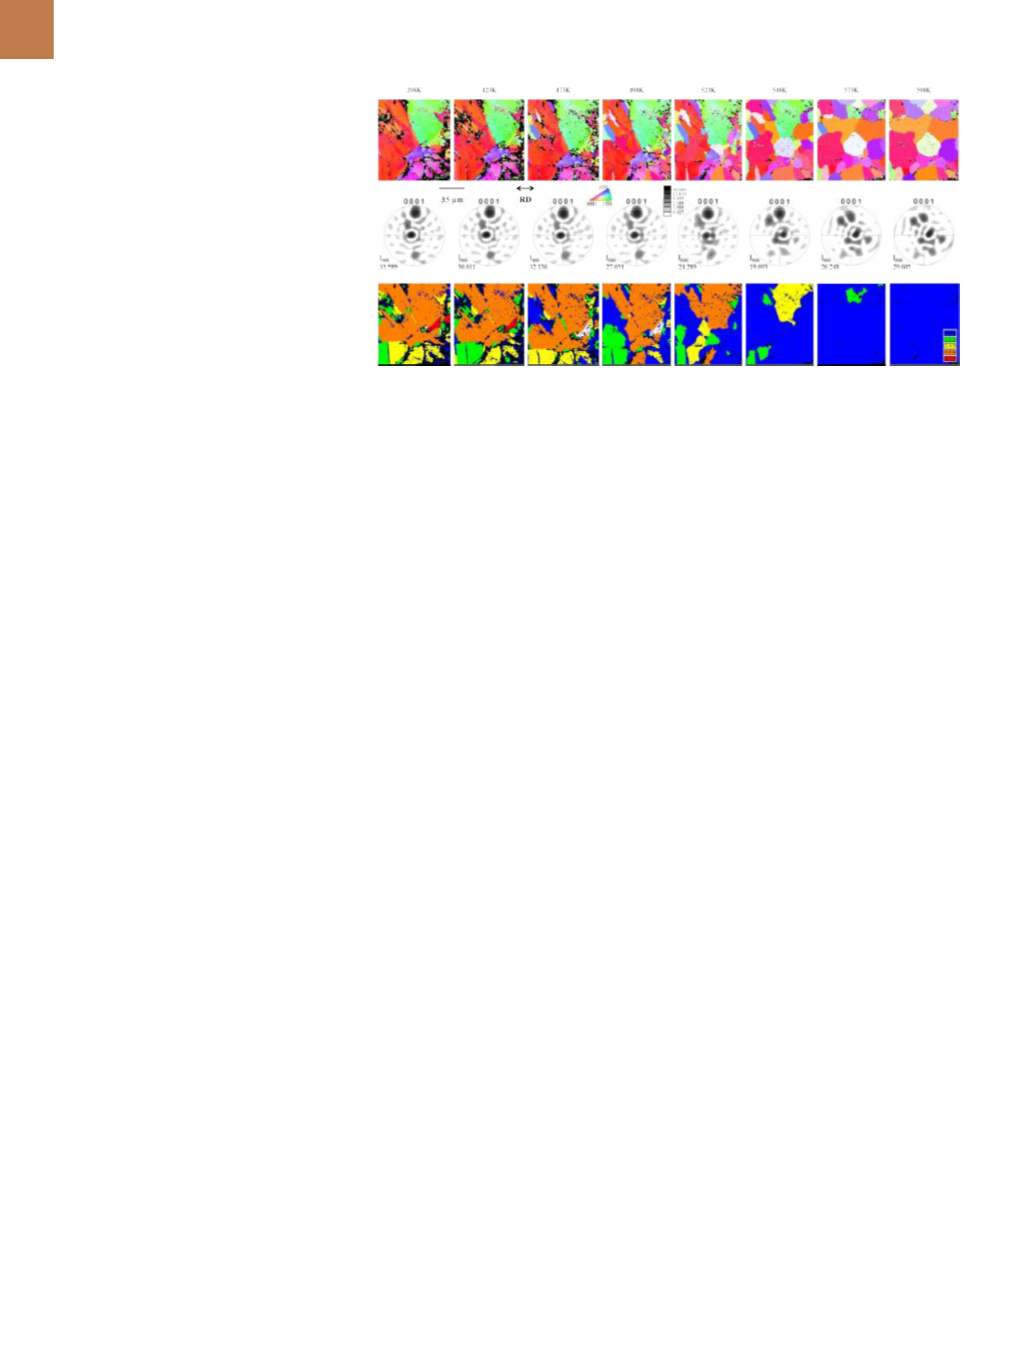
Figure 2 shows the EBSD inverse
pole figure (IPF) map, corresponding
texture in the form of {0001} pole figures
(along the normal direction of the sam-
ple), and the grain orientation spread
map of the same microstructural patch
depicting microstructure evolution as
a function of annealing temperature.
During the annealing process, new
grains appeared during the heating step
from 423 to 473 K (Fig. 2). As expected,
with new grain formation, the texture
intensity in the microstructural patches
decreased (Fig. 2). However, texture
intensity increased slightly during the
final annealing steps, which included
temperatures above 548 K. This was
expected to be due to grain growth and
therefore fewer grains were present in
the given microstructural patch ana-
lyzed. The orientation spread within
the grains was less than 1.5° in the area
analyzed after the 548-573 K heating
step, suggesting that the grains were rel-
atively free of strain accumulated during
rolling. At ~573 K, a completely recrystal-
lized microstructure was observed.
The orientation relationship of the
newly formed grainswith respect to their
neighbors after each heating step was
investigated. Specifically, the misorien-
tation angles and corresponding misori-
entation axis across the newly formed
grain boundaries were examined. The
grain boundaries with misorientation
angles greater than 15° were only con-
sidered in the analysis. For example,
Fig. 3 shows an EBSD IPF map of the
microstructural patch after reaching the
548 K heating step. Ten new grains were
formed during this step, resulting in 44
unique grain boundaries. The misorien-
tation angle-axis relationships for the
newly formed grain boundaries are tab-
ulated in Fig. 3.
This analysis was performed for
each heating step and the characteristics
of the grain boundaries formed during
Fig. 2 —
EBSD IPF map (top), corresponding texture in the form of {0001} pole figures (along
the normal direction of the sample) (middle), and grain orientation spreadmap (bottom) of
the same microstructural patch depicting the evolution of microstructure in rolled ZE20 as a
function of temperature. Black regions in the maps are un-indexed points. I
max
is the maximum
intensity values observed in the pole figures.