


 32 / 78

A D V A N C E D M A T E R I A L S & P R O C E S S E S | J A N U A R Y 2 0 1 6
3 2
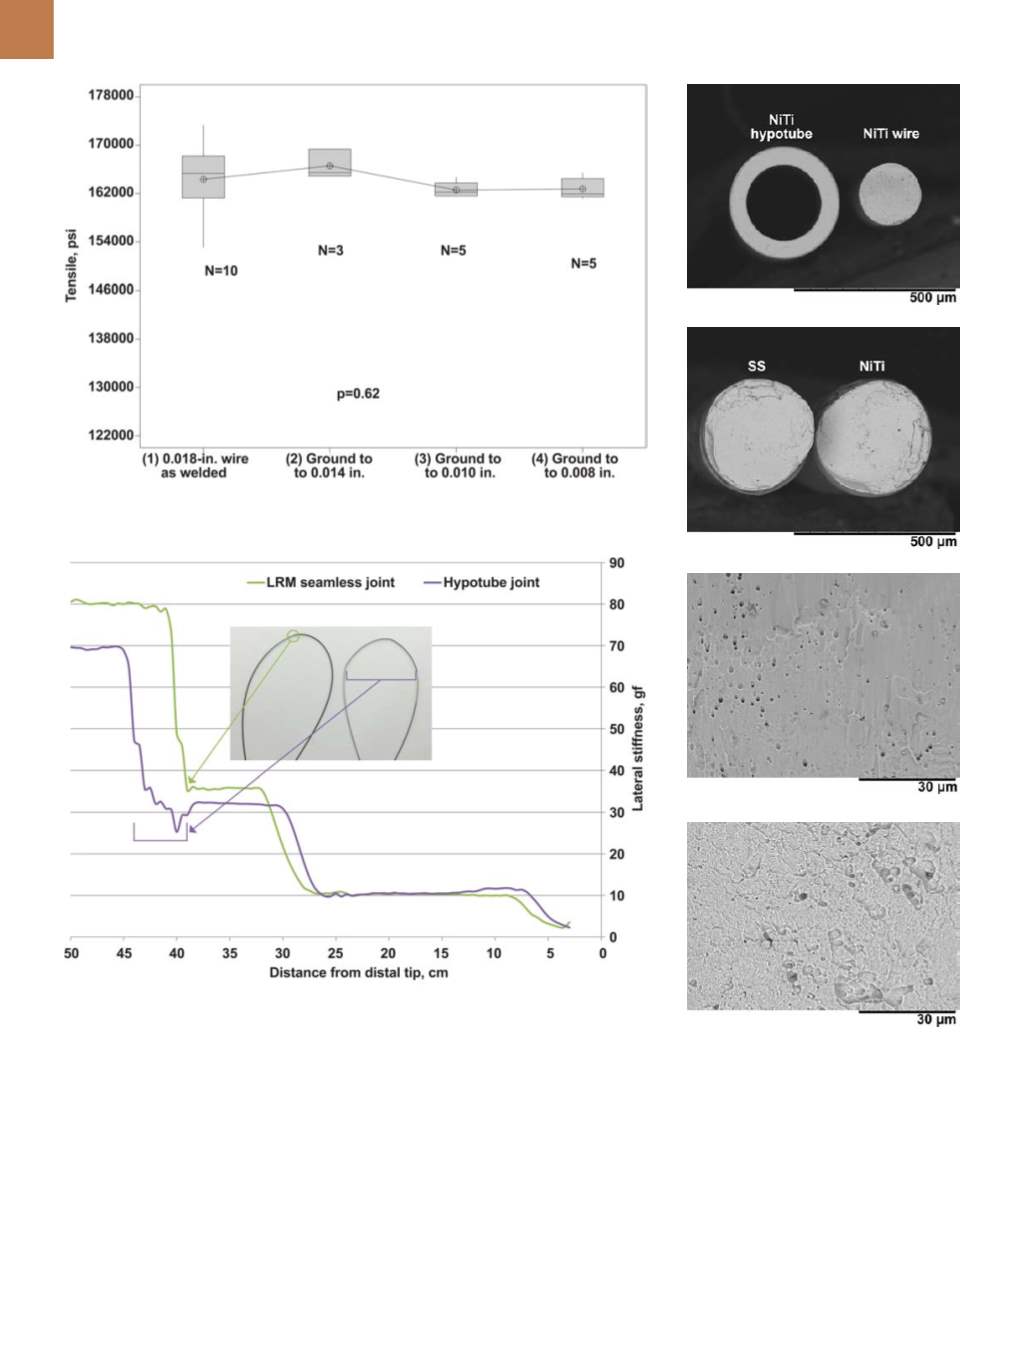
hypotube joint design exhibits sharp
transitions that could cause kinks and
performance degradation.
The lateral stiffness graph shows
the seamless nature of the LRM guide-
wire at around 40 cm from the distal tip.
A direct change in stiffness occurs at the
solid-state weld joint. Conversely, the
graph shows that the sample guidewire
with the 3-cm long hypotube joint has a
less desirable stiffness load profile.
Fig. 3 —
No statistically significant difference, at a 95% confidence level, in joint tensile strength
with reduction in cross-sectional area. This shows joint consistency.
Fig. 4 —
Lateral stiffness testing on 0.014-in. diameter guidewire with LRM solid-state joint,
compared to competitive guidewire with hypotube joint.
Fig. 5 —
SEM image of fracture surface, post
tensile testing. Lowmagnification (200×) of
hypotube joint and LRM solid-state joint,
respectively (a) and (b); high magnification
image (2000×) of NiTi wire side of hypotube
joint and LRM solid-state joint, respectively
(c) and (d).
Table 1 summarizes the tensile
data for 0.014-in. diameter LRM solid-
state welded guidewires. The LRM joint
exhibits high tensile strength compared
to the hypotube adhesive joint. Figures
5(a) and 5(c) show that the failure mode
for the hypotube joint design was ad-
hesive failure, with subsequent core
pullout from the hypotube. Therefore,
the Nitinol wire end exhibits a smooth
shear cut surface, Fig. 5(c). The LRM
solid-state weld joint failed at or near
the joint interface, Fig. 5(b). The frac-
ture surface of the LRM solid-state weld
exhibits micro-roughness and dimples
(a)
(b)
(c)
(d)