


 17 / 70

A D V A N C E D
M A T E R I A L S
&
P R O C E S S E S |
S E P T E M B E R
2 0 1 6
1 7
R
eactor-based neutron radiogra-
phy is a nondestructive, noninva-
sive characterization technique
used extensively to characterize engi-
neering materials
[1]
. It is often used
to inspect
[2,3]
, evaluate porosity, and
to observe parts in-operando
[4]
. Neu-
tron radiography has been flourish-
ing at reactor facilities for more than
four decades, but is relatively new to
accelorator-based neutron sources
[5]
.
Recent advances in neutron sources
and detector technologies include the
spallation neutron source (SNS) at Oak
Ridge National Laboratory (ORNL) and
the microchannel plate (MCP) detec-
tor
[6-8]
, respectively. These advances
enable new contrast mechanisms using
neutron scattering Bragg features for
crystalline information, such as average
lattice strain
[9]
, crystalline plane orien-
tation, and identification of phases in a
neutron radiograph
[10]
.
This new capability can help vali-
date emerging additive manufacturing
(AM) processes. AM holds enormous
potential to revolutionize manufac-
turing by enabling new designs with
complex geometries
[11]
that are not
feasible with conventional manufac-
turing processes. However, the tech-
nique lacks process optimization and
control standards compared with tradi-
tional processes. Residual stresses that
commonly occur when materials are
machined, heat treated, hot and cold
worked, and welded significantly affect
mechanical properties and durability.
Residual stresses can also occur during
AM. For example, defects in AM parts
such as internal cracks can propagate
over time as the component relaxes
after removal from the build plate.
Because AM parts can only be
assessed after completion, it is impos-
sible to identify defects early enough to
minimize expensive reruns. Current val-
idation of AM materials and processes
occurs mainly through expensive tri-
al-and-error experiments at the compo-
nent level. By comparison, the level of
confidence in predictive computational
modeling in conventional processes
is high enough to allow process and
materials optimization through compu-
tational approaches. Thus, nondestruc-
tive characterization techniques and
processing-microstructure
databases
are needed to develop and validate pre-
dictive modeling tools for AM.
PRINCIPLES OF NEUTRON
RADIOGRAPHY
Neutron radiography (nR) mea-
sures neutron beam attenuation
caused by absorption and scattering
within a sample using a 2D, position-
sensitive detector that measures trans-
mitted neutron flux. Neutron computed
tomography (nCT) measures neutron
beam attenuation in 3D by rotating a
sample to record attenuation for mul-
tiple beam paths through an object.
The sample is usually rotated from 0
°
to 180
°
, assuming the beam is parallel.
Data quality is improved by scanning
over the full 360
°
range (super-sam-
pling technique). Computational recon-
struction enables virtual visualization
of the sample in 3D.
Neutrons can be used to study
defects, grain orientation and size,
residual stress, and phase distribution
using both imaging and diffraction
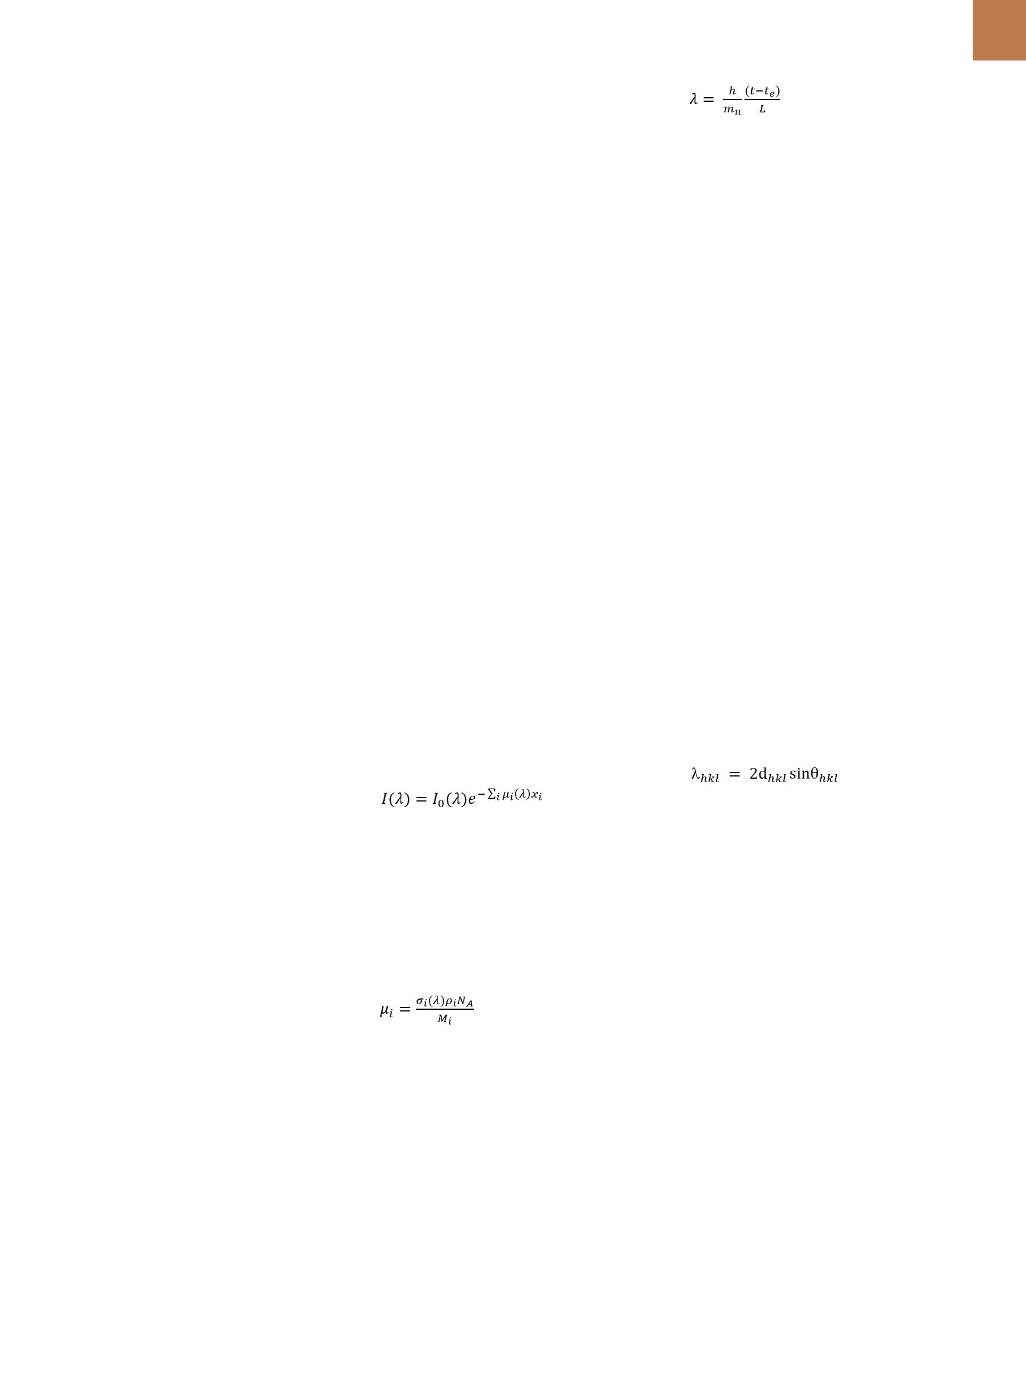
techniques. The principle of neutron
radiography is based on the Beer-
Lambert law given by:
(1)
where
I
(
λ
) is the transmitted beam
intensity for a neutron of wavelength
λ
;
I
0
(
λ
)
is the incident beam intensity;
and
µ
i
(
λ
)
is the linear attenuation coef-
ficient of element
i
, of thickness
x
i
, as
seen by neutrons. The linear attenua-
tion coefficient,
µ
i
is given by:
(2)
where
σ
i
(
λ
) is the neutron total cross
section (sum of scattering and absorp-
tion cross sections) of element
i
,
ρ
i
is
material density,
N
A
is Avogadro’s num-
ber, and
M
i
is the element molar mass.
At a time-of-flight (TOF) neutron source,
such as the SNS, neutrons are produced
in pulses after being kinetically cooled
or moderated by light atoms, resulting
in an uncertainty in the time of emis-
sion,
t
e
,
when the neutrons leave the
moderator. Neutron wavelength,
λ
, is
determined by:
(3)
where
t
is the time of detection and
L
is the distance between the source and
detector. Such wavelength dependent
information is collected at a reactor
source, for example, by using a crystal
monochromator (a crystal that trans-
mits a selected band of neutron wave-
length). However, using this method
reduces incident intensity by almost
two orders of magnitude. All wave-
lengths within a pulse are collected at
an accelerator-based or TOF neutron
source, and wavelength (or energy)
is sorted by the time each neutron is
observed, reducing acquisition time
from several days to a few hours. This
enables acquiring neutron data at the
highest TOF resolution achievable and
post-processing the data in 2D and 3D
images. Because neutron cross sections
are wavelength dependent, the inten-
sity of each pixel of the radiograph,
I
,
obtained at different wavelength ranges
displays a different contrast. In non-
textured crystalline materials, narrow
dips and abrupt edges in pixel intensity
occur at precise neutron wavelengths
specified by Bragg’s law:
(4)
where
d
hkl
is the interplanar distance
for the (
hkl
) atomic planes and
θ
hkl
are
the Bragg angles (angles between the
incident neutron beam and crystalline
planes). At a given (
hkl
) and for
θ
hkl
<
90° or
θ
hkl
> 90°, neutrons scatter/dif-
fract or transmit, respectively. At
θ
hkl
=
90°, the neutron wavelength reaches
λ
=
λ
hkl
, neutrons reach the lowest
transmission, and the darkest pixels are
indicative of the
hkl
orientation, thus
effectively creating a map of preferred
crystalline plane orientations averaged
through the thickness of a material.
The wavelength resolution of a
neutron instrument, Δ
λ
/
λ
, and the
absence/presence of texture define
the shape of the Bragg edge. Assum-
ing sufficient wavelength resolution
[10]
,
sharp Bragg edges are indicative of
texture-free material. The position of
the Bragg edge is defined by the applied
or residual stress in the sample
[9,12]
. The
precise location of the Bragg edge as a