


 18 / 70

A D V A N C E D M A T E R I A L S & P R O C E S S E S | S E P T E M B E R 2 0 1 6
1 8
function of spatially related applied or
residual stress conditions can directly
measure d-spacing of an imaged sam-
ple over the entire view area with single
pixel size defining the gauge volume,
leading to potentially increased spatial
resolution of the strain maps.
Using neutrons to image residual
stress enables nondestructive pene-
tration deep into large components.
Hard (high energy) x-rays offer similar
penetration capability (depending on
the material), but the relevant diffrac-
tion angles are very small, so gauge
volumes are needle-like, which is prob-
lematic for measuring one component
of the stress. Therefore, the two tech-
niques are highly complementary and
are increasingly used in combination.
A limitation of the residual stress and
Bragg-edge imaging techniques is the
ability to time-stamp neutrons at a
very high temporal resolution to pro-
vide a mechanism to detect Bragg
shifts. Analysis of the imaging pattern
using single Bragg peak fit or full pat-
tern Rietveld refinement gives an accu-
rate value for the interplanar spacing,
d
hkl
, fromwhich the lattice strain,
ε
, can
be determined by:
(5)
where
d
0
is the reference interplanar
spacing under stress-free conditions.
For tensile strain,
d
hkl
is greater than
d
0
,
which means the Bragg’s peak shifts to
a smaller angle; for compressive strain,
d
hkl
is smaller than
d
0
.
PUTTING NCT TO WORK
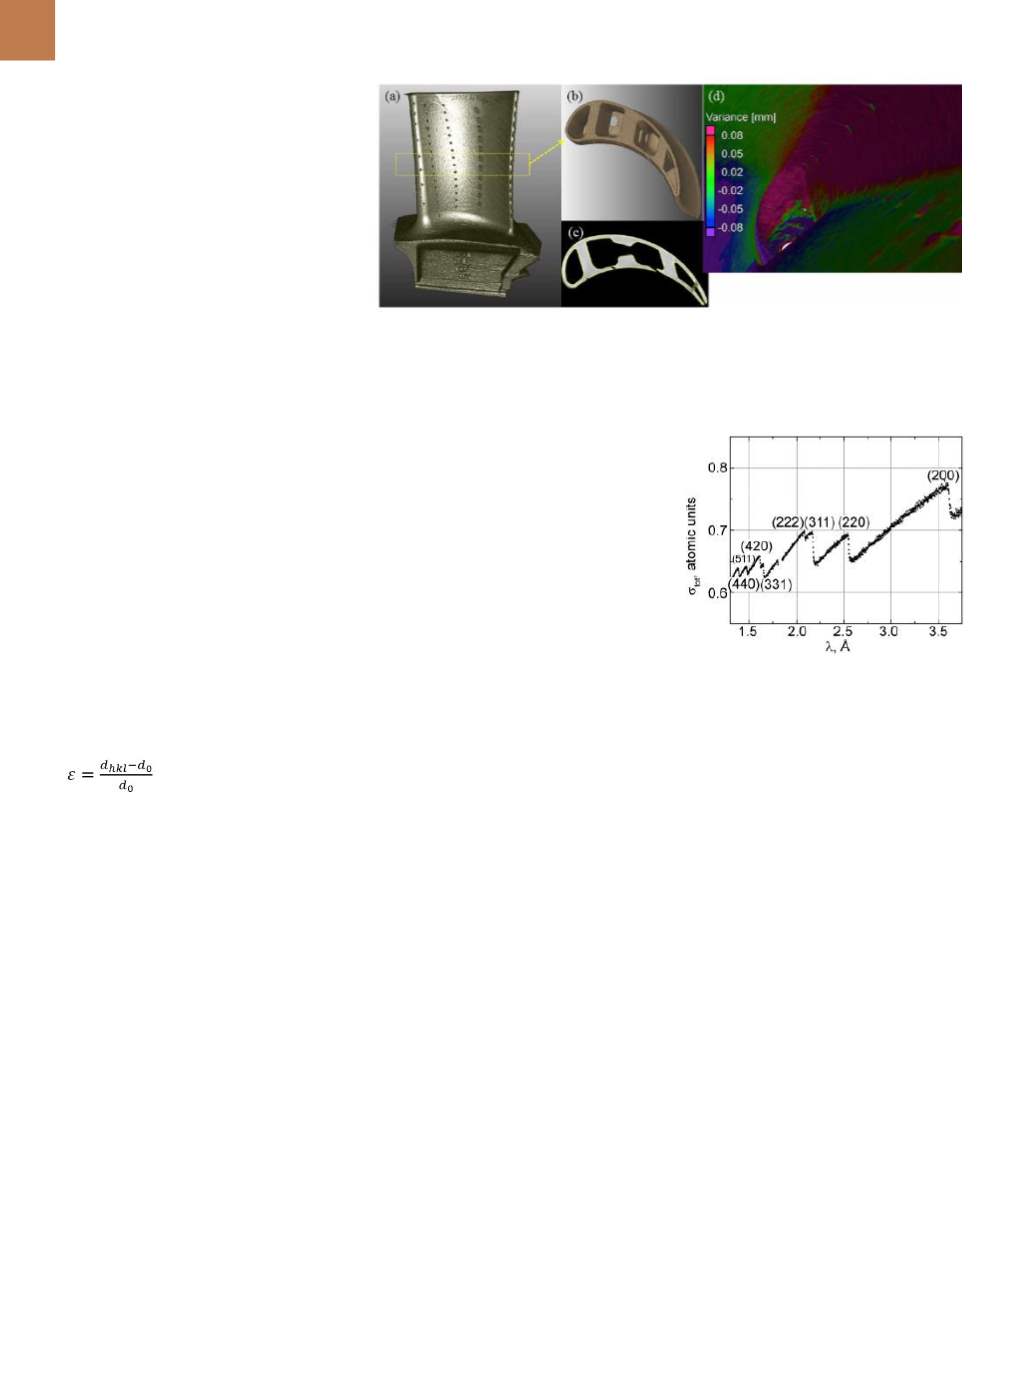
A 70-mm-tall Inconel 718 turbine
blade made by AM was measured using
nCT at the high flux isotope reactor
(HFIR) CG-1D neutron imaging beam-
line at ORNL
[13]
. Figure 1a shows the
blade’s rendered volume obtained from
nCT using fake coloring. Virtual studies
can be performed on a selected sec-
tion of the part (Fig. 1b) or on a slice-
by-slice basis (Fig. 1c). Figure 1c shows
the nCT attenuation slice in gray scale
overlapped with the outline of the
component (in yellow) from the engi-
neering drawing from which the part
was printed. This direct comparison
Fig. 1 —
Examination of AM Inconel 718 turbine blade using neutron computed tomography:
(a) nCT rendered volume; (b) virtual section from yellow outlined area in nCT data; (c) engineer-
ing drawing contours (yellow) overlapping neutron slice (gray); (d) color map of blade internal
structure shows variance from engineering drawing (purple and pink).
Fig. 2 —
Total neutron cross section as a
function of wavelength for Inconel 718 powder.
Increase of statistical noise at higher wave-
lengths is due to the decrease of neutron flux at
these wavelengths. The gap between (311) and
(222) is due to a detector acquisition time-out.
can be performed for the complete vol-
ume. Overlapping the outline virtually
enables various nondestructive mea-
surements including:
• Dimensional accuracy (printing
tolerance)
• Distortion (Fig. 1c)
• Defects and surface roughness of
internal structure not reachable
using conventional characterization
techniques without cutting (Fig. 1d)
• Porosity
Figure 1d also shows an inter-
nal air path with acceptable deviation
(
±
0.08 mm) from the engineering draw-
ing (indicated from red to blue), and
outside tolerance (indicated in pink and
purple). A shift of the channel walls (in
pink and purple) may have occurred
due to the part relaxing after printing.
A video of the overlap of the turbine
blade design and nCT is available at
https://youtube.com/watch?v=eLTJl-bqICno&feature=youtu.be.
The study is done systemati-
cally at the resolution capability of
the neutron imaging system (50
µ
m in
this case), and is fed back to model-
ing capabilities to optimize printing
parameters. In particular, areas of
material removal and surplus can be
tracked down throughout the sample
volume, including internal structures
(Fig. 1c). In addition, it is possible
to directly measure the evolution of
defects by measuring a standard sam-
ple before and after removal of the
build plate and overlapping nCT scans.
Figure 2 illustrates the Inconel 718
powder Bragg edges (equivalent to a
nontextured sample) measured at the
SNS Vulcan diffractometer. Edges are
sharp (as expected for a powder sam-
ple that has no preferred grain orien-
tation), and their respective positions
correspond to theoretical Bragg edge
values calculated using d-spacing (
d
=
3.595 Å) of Inconel 718 at the SNS Vul-
can beamline. Powder data represent
the ideal case and Bragg edge is drasti-
cally altered in a textured sample with a
grain size distribution.
Bulk samples were prepared from
the Inconel powder mentioned previ-
ously using electron beam melting at
the ORNL Manufacturing Demonstra-
tion Facility. Samples were fabricated
while manipulating the electron beam
to form a real melt, which resulted in
solidification of grains in a random
manner. Figure 3a shows a represen-
tative electron back scatter diffraction