


 36 / 62

iTSSe
TSS
A D V A N C E D M A T E R I A L S & P R O C E S S E S | J U L Y / A U G U S T 2 0 1 6
3 6
iTSSe
TSS
6
FEATURE ARTICLE
O
ptical or light microscopy (OM) uses the visible or
near-visible portion of the electromagnetic spectrum
and is one of the oldest characterization techniques.
With any cold spray coating, it is the first characterization pro-
cess used to evaluate and optimize process variables.
First, an estimate of the as-sprayed coating thickness
and coating porosity is evaluated, and an assessment of the
coating-substrate interface integrity is performed. The easi-
est way to assess coating formation as a function of various
coating parameters, such as spray angle, standoff distance,
raster speed, deposition efficiency, and powder feed rate,
is the optical microscope. Nearly all reports on cold spray
coatings begin with this characterization, which is funda-
mental to assess coating quality.
OM is often used to optimize process parameters for
obtaining dense, pore-free coatings. Trials on cold spray coat-
ings have been performed on several puremetals, such as alu-
minum, copper, titanium, tantalum, nickel, and magnesium,
as well as alloys based on aluminum (2052, 6061), magnesium
(AZ31B, ZE41A), nickel (IN718, IN625, IN738), and titanium (Ti-
64, CP-Ti), with optical micrographs of the as-processed coat-
ing. Inmost cases, coatings become denser when heat treated.
However, in certain cases, they become more porous.
A quantitative estimation of porosity, determined by
using image analysis attached to an optical microscope, is
usually the best way to characterize coating density. The
effects of process gas (helium vs. nitrogen vs. air) as well
as various process conditions, such as standoff distance,
speed, and deposition efficiency, are discerned by using OM.
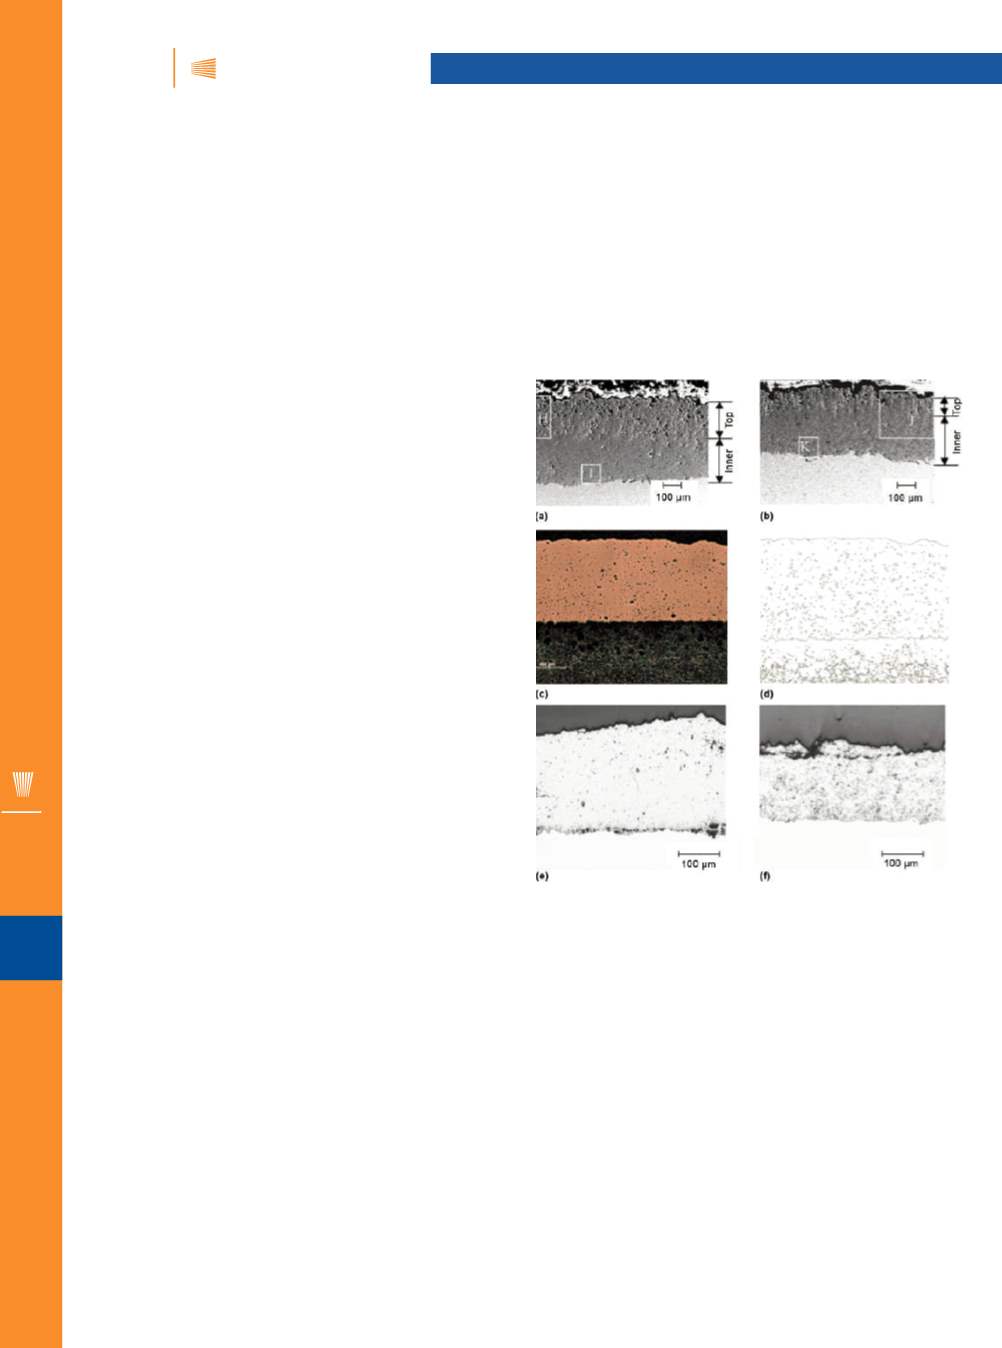
Figure 1 (a) and (b) show representative optical micro-
graphs comparing a
∼
0.3 mm (0.01 in.)-thick titanium cold-
spray coating, which was sprayed using nitrogen and helium
gas in the as-sprayed condition. A clear distinction can be
seen between the porous top region and the dense inner
region between the two coatings, revealing an important
aspect about the tamping effect of the two gases in the den-
sification of the coating.
Figure 1 (c) and (d) illustrate an image analysis of coat-
ing porosity measurement of a pure copper coating. The
optical micrographs in Fig. 1 (e) and (f) reveal coating inter-
face and surface, respectively, of a WC-Co coating. OM was
COLD SPRAY: ADVANCED CHARACTERIZATION
METHODS—OPTICAL MICROSCOPY
This new article series explores the indispensable role of characterization
in the development of cold spray coatings and illustrates some of the
common processes used during coatings development.
Dheepa Srinivasan, GE Power, GE India Technology Center, Bangalore
Fig. 1 —
Optical micrographs show comparison of overall coating
thickness and top layer thickness between a nitrogen-spray and
helium-spray copper coating, respectively (a, b); image analysis
evaluated porosity in a pure copper coating (c, d); and interface and
top surface in a WC-Co cermet coating sprayed using nitrogen gas
(e, f).
used to map process variables to obtain dense coatings for
an aluminum coating, by etching an aluminum coating and
mapping the microstructure evolution as a function of tem-
perature as shown in Fig. 2 (a) and (b).
Observation of the nature of particle deformation and
input from optical micrographs enables numerical simula-
tion, as shown in Fig. 3 (a) to (c). Sample preparation for OM
is usually straightforward involving metallography, namely
cutting the coating either transversely or along the direc-
tion of spray, mounting the cross-section using a resin, and