


 26 / 66

A D V A N C E D M A T E R I A L S & P R O C E S S E S | F E B R U A R Y 2 0 1 5
2 6
Additionally, a simple screening
test was used to detect decarburized
specimens of 5160H, 5160M, and 9260M
spring steel lots used for front wheel
drive automobile springs. As the de-
sign loads on these springs increased
throughout the 1970s, no free ferrite
and almost no MAD could be permit-
ted or spring life would be reduced.
Mill processing helped minimize the
MAD to less than the amount removed
in the final processing step of turning
and burnishing. Figure 6 shows data
for a number of specimens where the
surface scan was removed by glass-
bead blasting after hardening and bulk
Rockwell C tests were made on the OD
surfaces at a number of locations and
averaged. Bars were sectioned, me-
tallographically prepared, and rated
for maximum free-ferrite depth (when
present) and maximum affected depth
of decarburization. The plot shows a
much better correlation between HRC
and MAD when free ferrite was not pres-
ent versus when it was present.
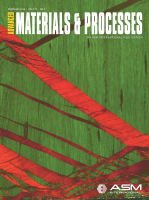
Examples of the variation in decar-
burization ratings by three methods—
carbon analysis of incremental turnings,
microindentation hardness traverses,
and visual qualitative or quantitative es-
timates by light microscopy—are shown
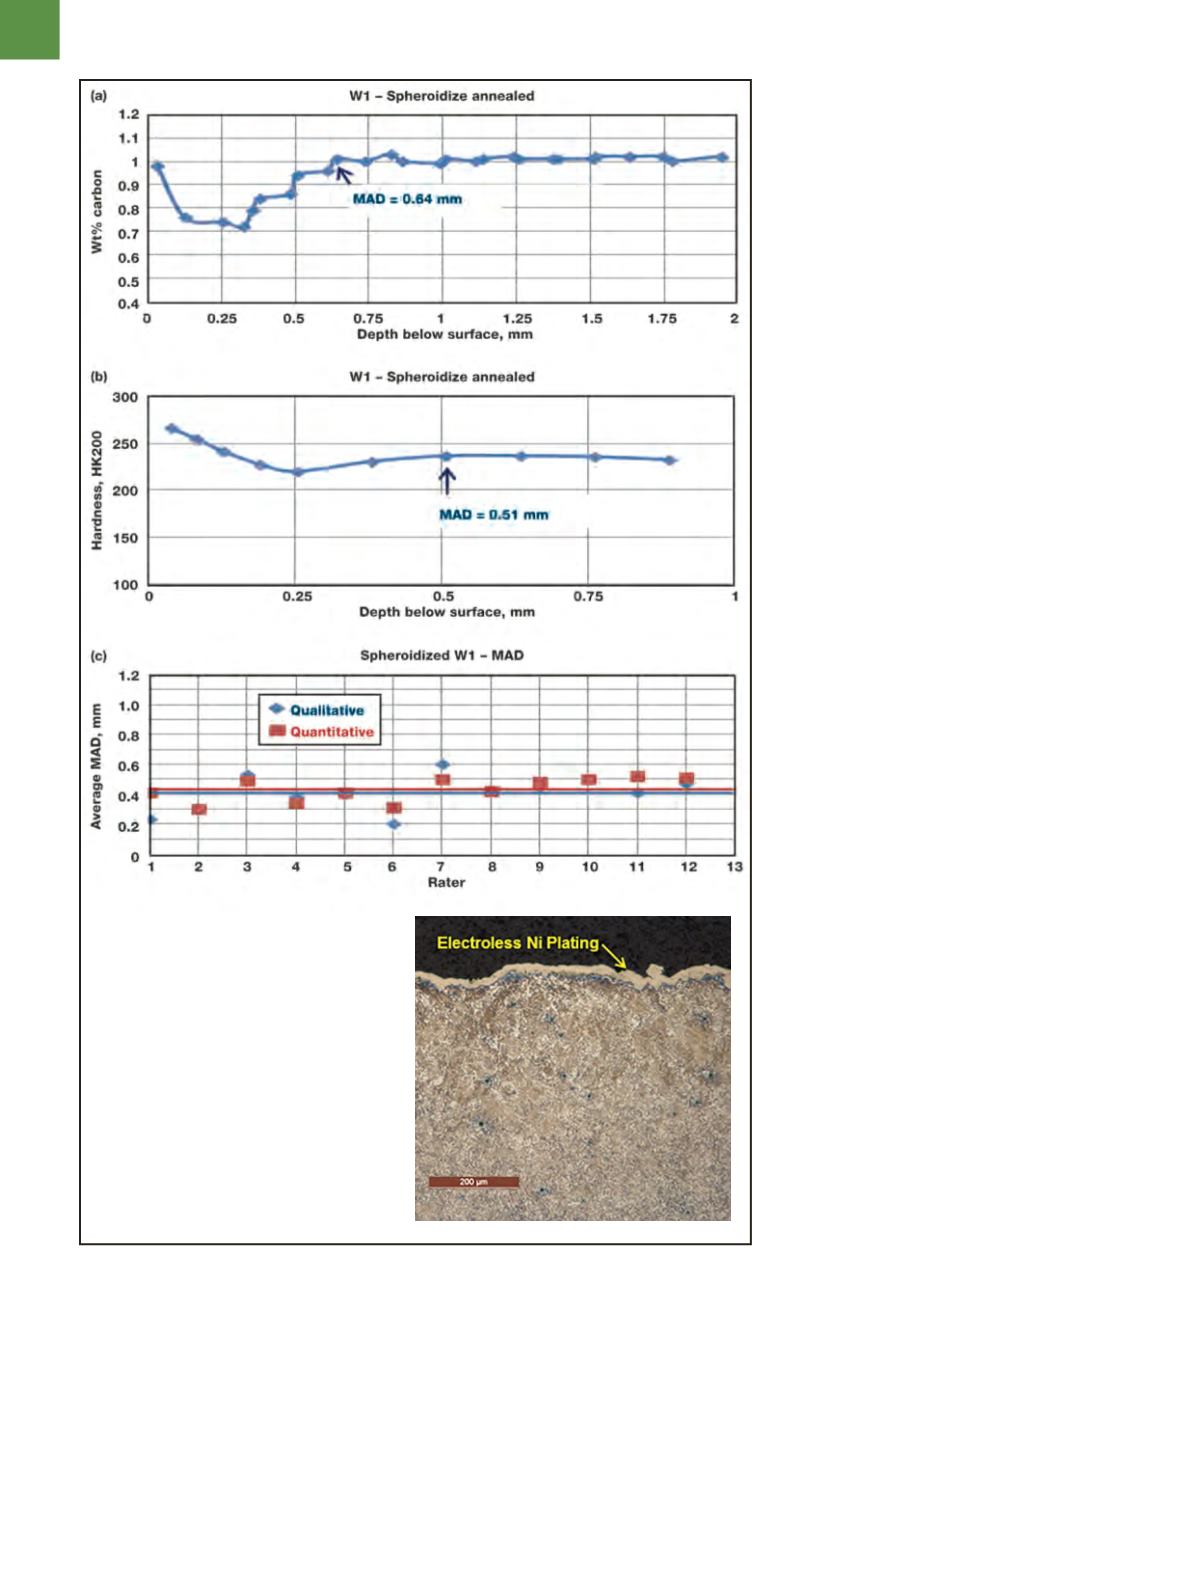
in Fig. 7. The spheroidize annealed mi-
crostructure of W1 carbon tool steel
(~1% C), a typical specimen rated by mill
metallurgists in plants that make tool
steel, is shown in Fig. 7d at 100×. The
carbide in the decarburized surface zone
exhibits a significantly lower volume
fraction than the interior. At the extreme
surface, individual carbides can be seen.
Note the seemingly unusual carbon dis-
tribution at the surface in Fig. 7a. The
lowest carbon content is only to about
0.7%, roughly a 30% loss. So, free fer-
rite is not present. Examination at 1000×
shows that the cementite in the decarbu-
rized zone is not well spheroidized but
tends to be lamellar. This is because the
annealing cycle cannot spheroidize ce-
mentite in the lower carbon surface area
compared to the bulk carbon content.
Note that the hardness at the surface of
the decarburized zone is actually greater
than in the core, a result that may seem
counterintuitive. However, as some tool
steel metallurgists are aware, coarse
lamellar carbide structure—even with a
lower volume fraction than the spheroid-
ized core—is harder and less ductile.
Carbon analysis of the incremental
turningsprovides thebest estimateof the
maximum affected depth. The MAD esti-
mate is more accurate using the Knoop
traverses than LOMmeasurements, but is
still rather conservative compared to the
MAD from actual carbon analysis. How-
ever, this is not amajor problembecause
the hardness became essentially con-
stant at a shallower depth than shown
by the incremental carbon analysis. The
qualitative estimates, based on a simple
visual estimate going around the bar’s
periphery, are slightly lower than the
Fig. 7
—Decarburization
measurements on a spheroidize
annealed bar of W1 carbon steel.
a) Carbon analysis of incremental
turnings reveal a MAD of 0.64 mm.
b) A 200 gf Knoop hardness traverse
reveals a MAD of 0.51 mm.
c) Qualitative and quantitative visual
LOM estimates yield MADs of 0.406 and
0.433 mm, respectively. d) LOM image
of a typical surface area.
(d)