


 20 / 66

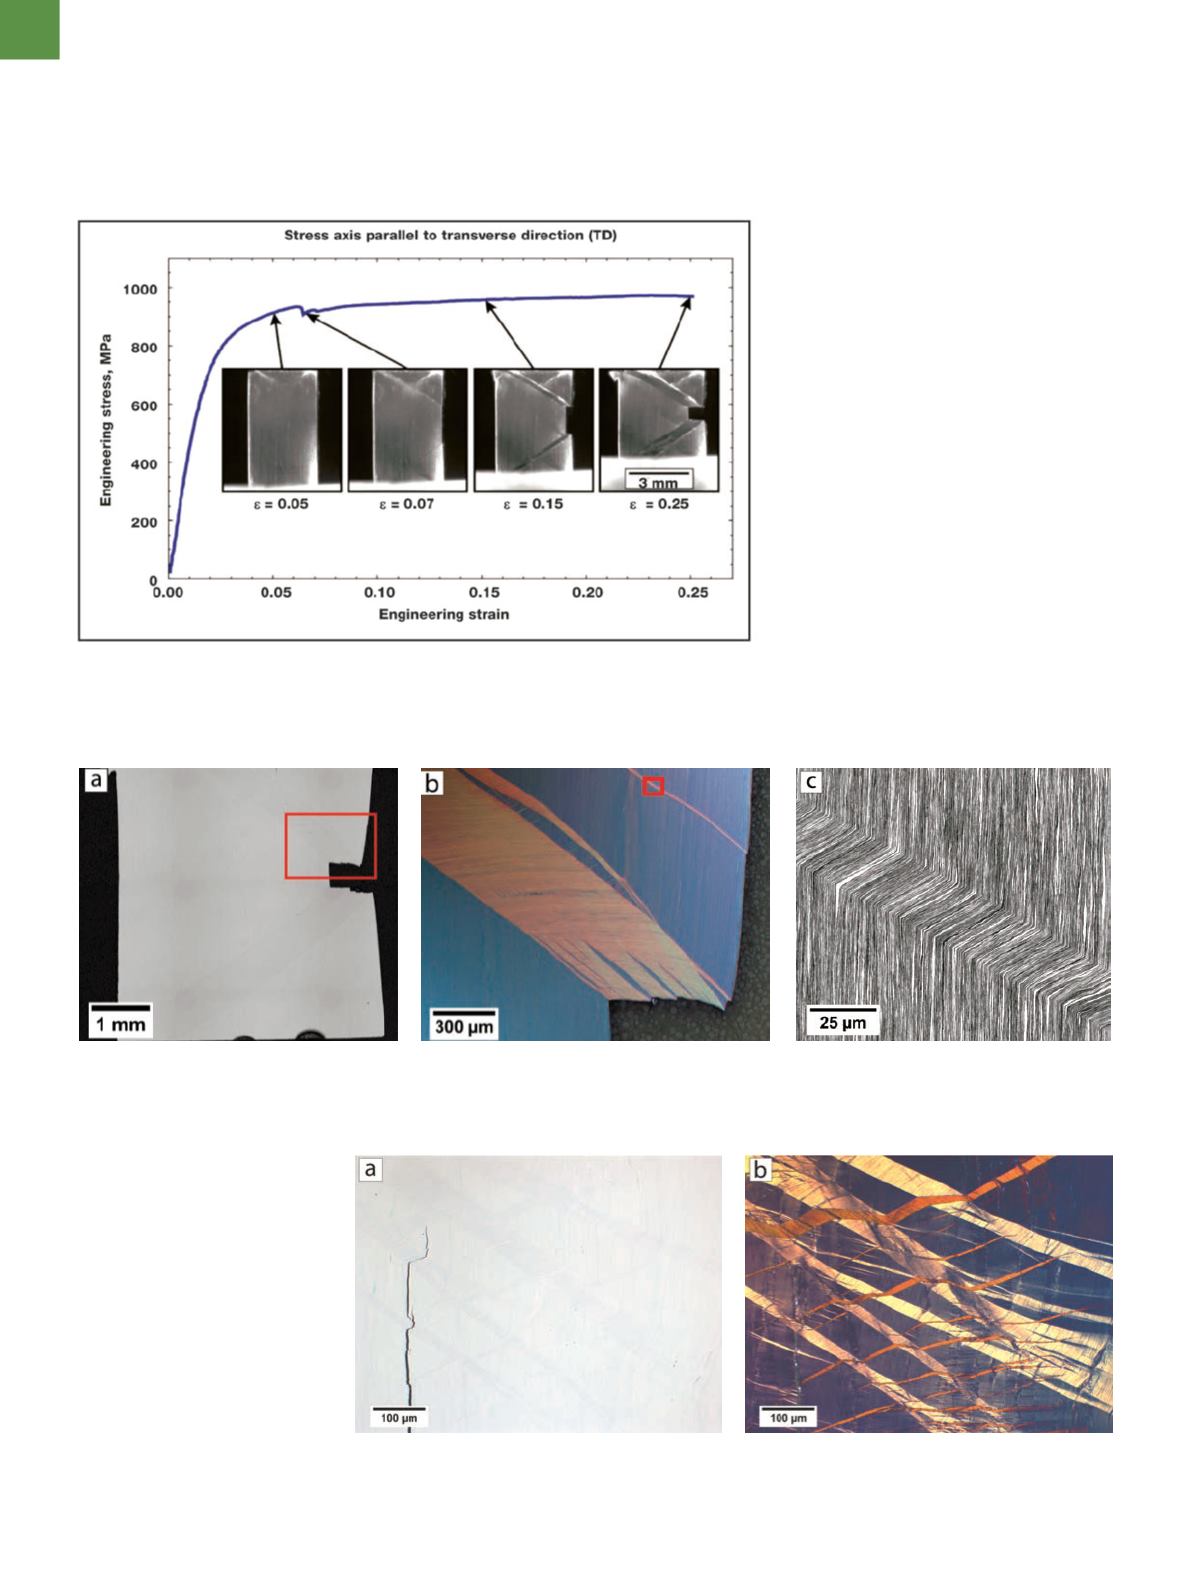
as seen in Fig. 3. In situ imaging shows
that bands of localized deformation
form shortly after yield, but do not lead
to failure. Post-test metallographic char-
acterization reveals that the dark bands
evident during in situ imaging do not
correspond to cracks or microstructural
damage, as demonstrated using bright-
field light optical microscopy (LOM) in
Fig. 4a. Instead, these bands are kink
bands in which the lamellar structure re-
mains continuous but has been uniform-
ly sheared and rotated (Figs. 4b and 4c).
While these deformation structures lack
sufficient contrast when imaged using
bright-field LOM (Fig. 5a), polarized light
microscopy clearly reveals that complex
networks of kink bands can form in these
specimens (Fig. 5b).
In addition to forming during uniax-
ial compression tests, kink bands also oc-
cur during bending, Charpy impact tests,
and even high strain rate ballistic tests
where local compressive strains occur.
Kink band formation in a wide range of
both quasi-static and dynamic mechan-
ical tests suggests that it is an important
deformationmode, likely to occur during
many forming operations and potential
structural applications.
While strain localization is almost
universally viewed as detrimental to
a metal’s mechanical properties, kink
band formation in Cu-Nb nanolaminates
may be an exception to this rule. Unlike
other forms of strain localization, such
A D V A N C E D M A T E R I A L S & P R O C E S S E S | F E B R U A R Y 2 0 1 5
2 0
Fig. 3
— Stress strain curve from a 65 nm layer thickness Cu-Nb nanolaminate displays
a perturbation at 7% engineering strain. In situ video recording of the compression
specimen reveals that this point corresponds to pronounced inhomogeneous
deformation due to kink band formation.
Fig. 4
—Optical and scanning electron microscopy reveal that kink bands are responsible for the pronounced shape change that occurred
during compression of the 65 nm specimen. Bright-fieldmicroscopy shows the absence of cracks along the kink bands (a). Sub-region of (a)
imaged using circular differential interference contrast (b). Sub-region of (b) imaged using backscatter scanning electron microscopy (c)
[7]
.
Fig. 5
—Bright-field image of kink bands in the 65 nm specimen showing poor kink band contrast (a).
Same field of view as (a) imaged using polarized light microscopy (b). Polarized light allows the complex
network of kink bands to be clearly revealed and highlights many small kink bands not evident in (a).