


 29 / 74

compaction. The process can produce either standard or
super high compaction tonnages resulting in very high-
density parts with improved mechanical properties. In addi-
tion to the unique loading sequence and high tonnage, the
process occurs over a relatively short time frame—only a few
hundred ms. Figure 3b illustrates improved densification
with the CDC method compared to traditional PM
processes when compacting iron powders, as one example.
Another benefit is that the CDC press itself is rela-
tively simple and compact. For example, a 4137 MPa (300
ton) mechanical or hydraulic press is typically two floors
tall and contains many moving parts and complex hy-
draulics. A 300-ton CDC press is not much larger than a
phone booth and has one moving part (Fig. 2). When the
fill gas is ignited, the ram rapidly presses down but does
not slam into the tooling or powder. The process is not
only fast and powerful, but also smooth and continuous.
The CDC process routinely operates at compaction loads
of 2069 MPa (150 tsi) in sharp contrast to conventional
compaction processes, which are generally limited to 690
MPa (50 tsi).
Because the CDC press directly converts chemical en-
ergy into mechanical compaction energy, it is highly en-
ergy efficient and capable of producing enormous
compaction loads. To date, several presses of increasing
size have been constructed, including manual 300, 400, and
1000-ton presses as well as an automated 400-ton press in
full operation (Fig. 2). Based on application needs, it is pos-
sible to further scale up the CDC press to very high ton-
nages without dramatically increasing the press size.
CDC material properties
The CDC process operates at compaction pressure
loads of 15 to 150 tsi compared to conventional PM press-
ing by mechanical or hydraulic methods, which are gener-
ally limited to 50 or 55 tsi. It is widely accepted that
controlled higher compaction pressures generally make a
large difference in part quality, both in the unsintered and
ADVANCED MATERIALS & PROCESSES •
SEPTEMBER 2014
29
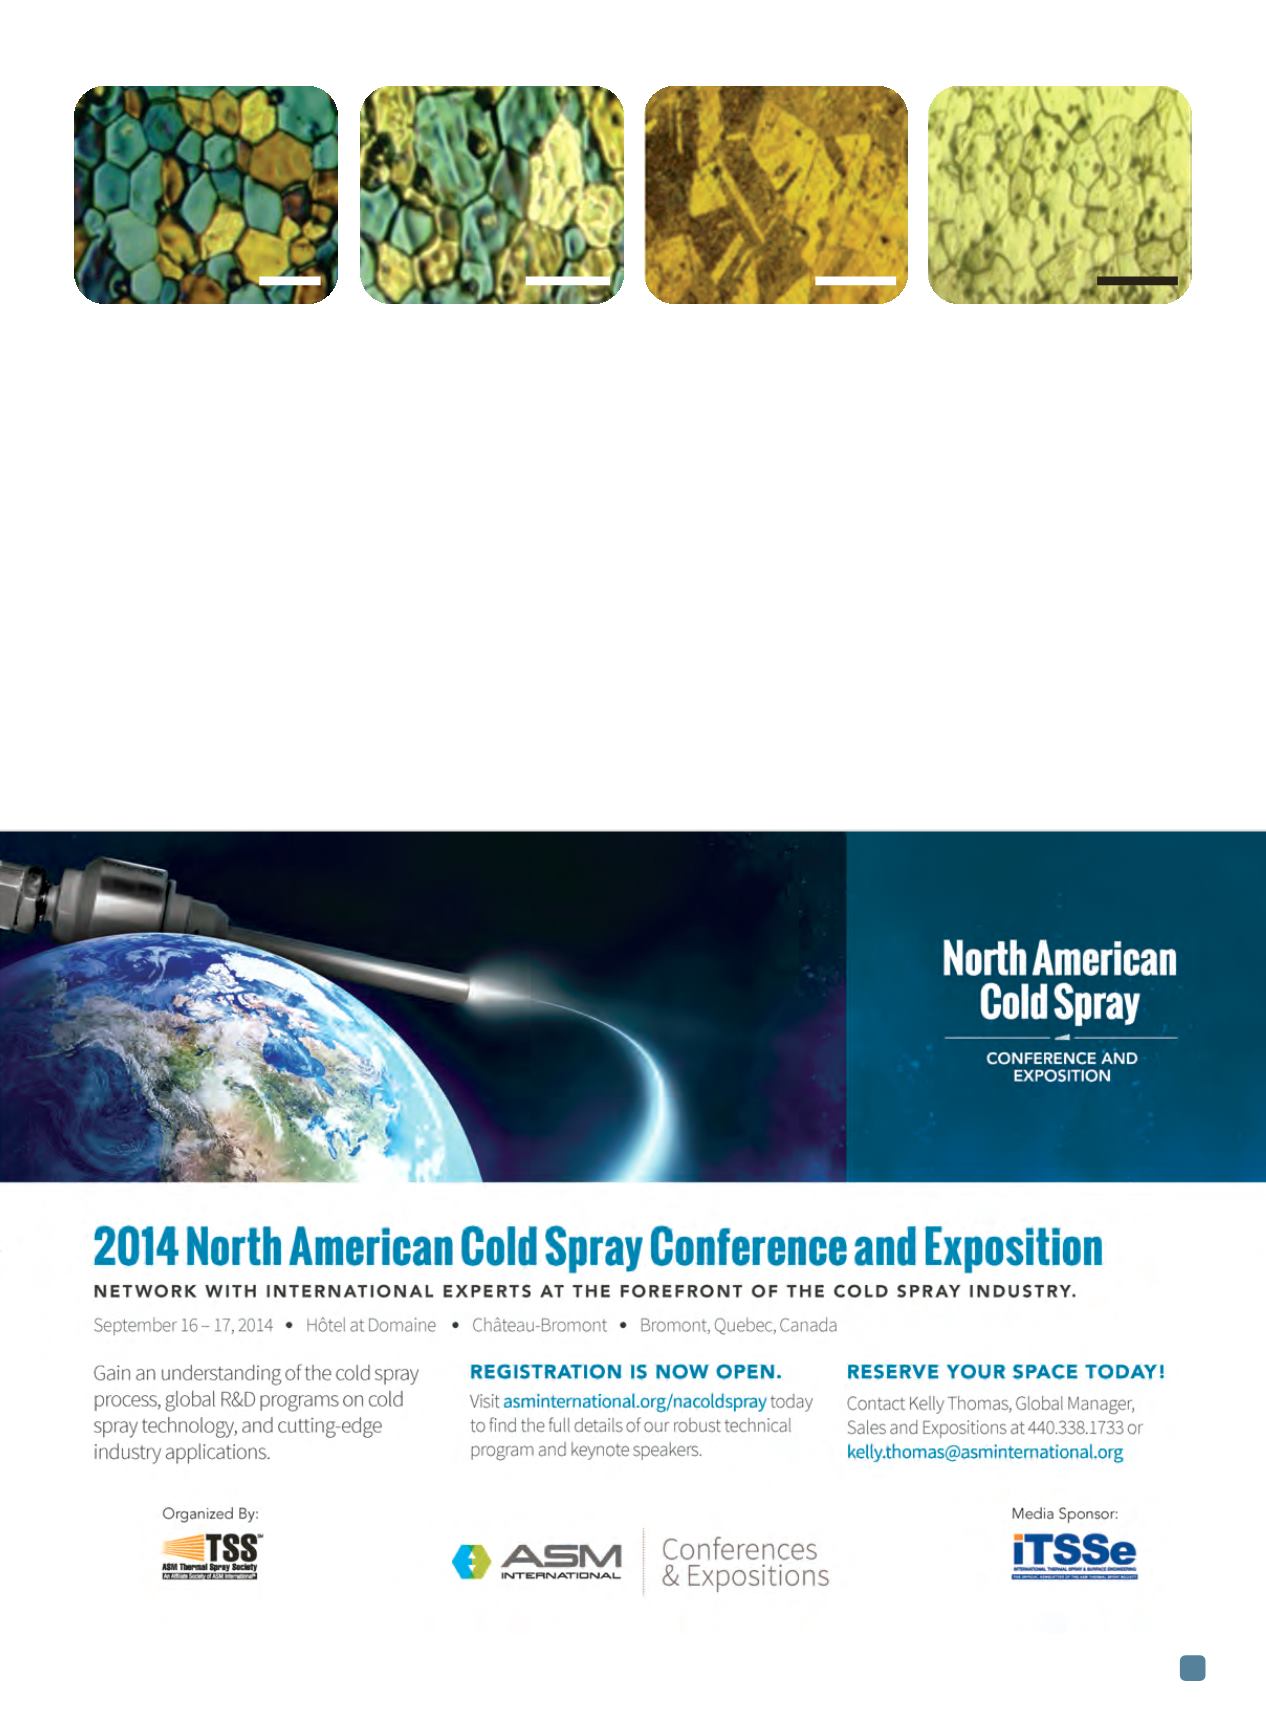
Fig. 4 —
Examples of controllable sintered microstructures under optimized processing for CDC Mo (a), TZM, a Mo alloy (b), Cu (c), and W (d).
(a) (b) (c)
(d)
150 µm
50 µm
50 µm
30 µm