


 22 / 50

with DCPD, potential drop is measured continuously or
periodically from the specimen, so a real-time crack size
measurement is available. The
J-Integral
calculation is
performed in the same manner as EUC or normalization
to yield the J-R curve.
Once the original J-R curve from DCPD is ob-
tained, adjustments are needed to differentiate po-
tential drop due to stable crack growth from material
deformation
[7, 13]
. Although difficulties still exist in
adjusting DCPD data to yield valid J-R curve results,
new methodology
[14]
shows improved results over
previous DCPD adjustment methods
[15]
with prom-
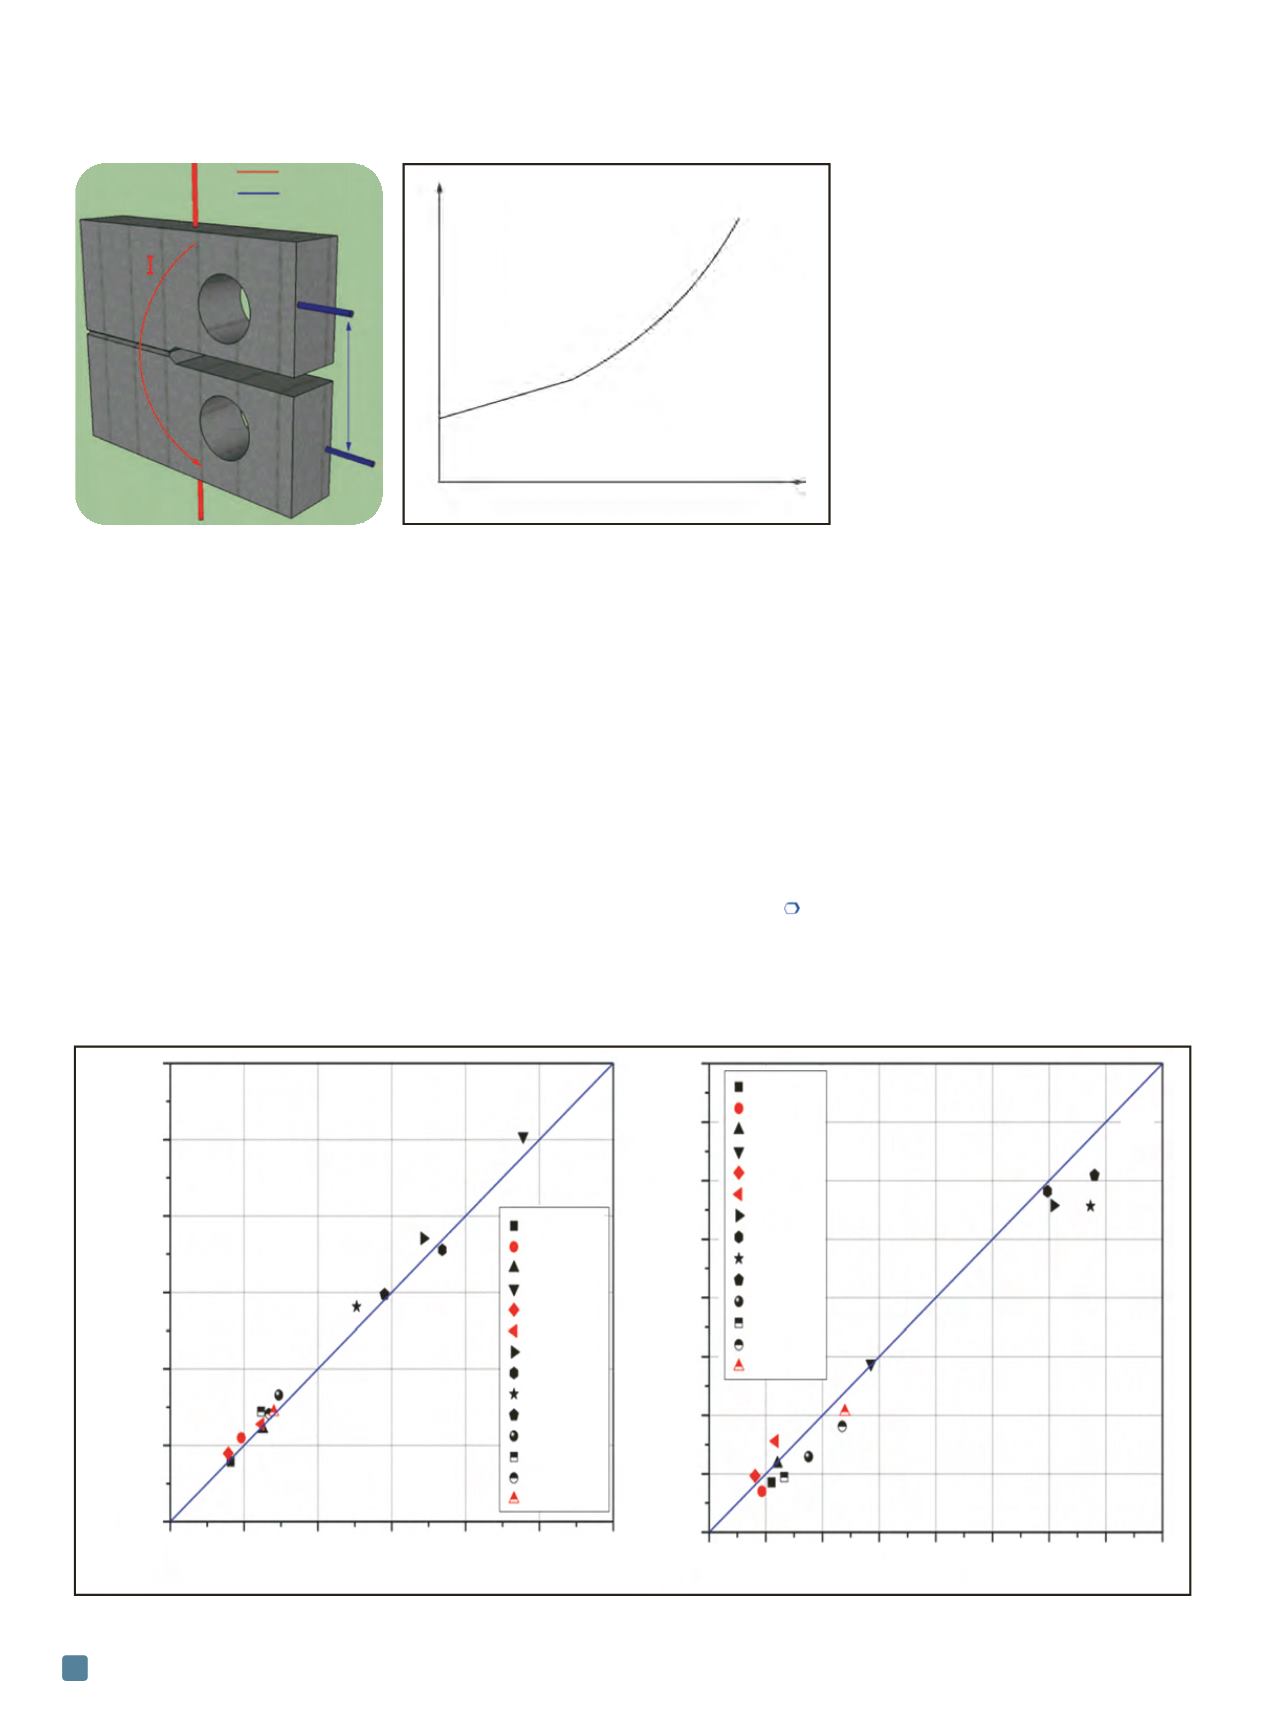
ising J-R curve results. As shown in Fig. 8, after in-
corporating the new adjustment procedure, ductile
fracture toughness near the initiation of stable crack
growth ( Jq) from DCPD is in excellent agreement
with results from EUC and normalization, whereas
only small deviations are observed
in tearing modulus (T R ) results.
Summary
This article presents the experi-
mental setup and three different
techniques—EUC, normalization,
and DCPD—for evaluating ductile
fracture toughness in metals using
the J-R curve. The
J-Integral
calcula-
tion is the same in all three methods,
with differences primarily involving
crack size measurements. EUC relies
on material compliance to derive the
real-time crack size, while for the
normalization method, initial and
final crack lengths are measured and
intermediate crack sizes are determined based on the
normalization function. For DCPD, the correlation be-
tween potential drop and crack size is exploited to as-
sess crack size. All three methods are applicable for
testing in the normal temperature range. However, for
elevated temperature tests, the material relaxation be-
havior and increased friction between the loading cle-
vises and pins degrade the accuracy of the elastic
compliance measurements for the EUC method, so
normalization or DCPD should be used. In addition,
the original J-R curve based on DCPD requires adjust-
ment to account for the deformation-induced poten-
tial drop.
Acknowledgment
The authors are grateful to Chunghao Shih for his technical
review of this article.
ADVANCED MATERIALS & PROCESSES •
APRIL 2014
22
Fig. 7 —
Schematic for (a) direct current potential drop measurement and
(b) crack-growth-induced increase in potential drop.
Fig. 8
—
Comparison of post-adjustment DCPD J-R curve results with EUC (black symbols) or normalization (red symbols)
[14]
.
Current probe
Potential probe
U
(a) (b)
Potential drop U
Crack length a
y=x
y=x
0 200 400 600 800
1000 1200
Compliance or Normalization Jq
(kJ/m
2
)
1200
1000
800
600
400
200
0
DCPD Jq (kJ/m
2
)
0 100 200 300 400 500 600 700 800
Compliance or Normalization tearing modulus
800
700
600
500
400
300
200
100
0
DCPD tearing modulus
MatA 150
o
C
MatA 371
o
C
MatA 421
o
C
MatB 371
o
C
MatB 538
o
C
MatB 593
o
C
MatC 24
o
C
MatC 100
o
C
MatC 250
o
C
MatC 500
o
C
MatD 24
o
C
MatD 400
o
C
MatD 500
o
C
MatD 600
o
C
MatA 150
o
C
MatA 371
o
C
MatA 421
o
C
MatB 371
o
C
MatB 538
o
C
MatB 593
o
C
MatC 24
o
C
MatC 100
o
C
MatC 250
o
C
MatC 500
o
C
MatD 24
o
C
MatD 400
o
C
MatD 500
o
C
MatD 600
o
C