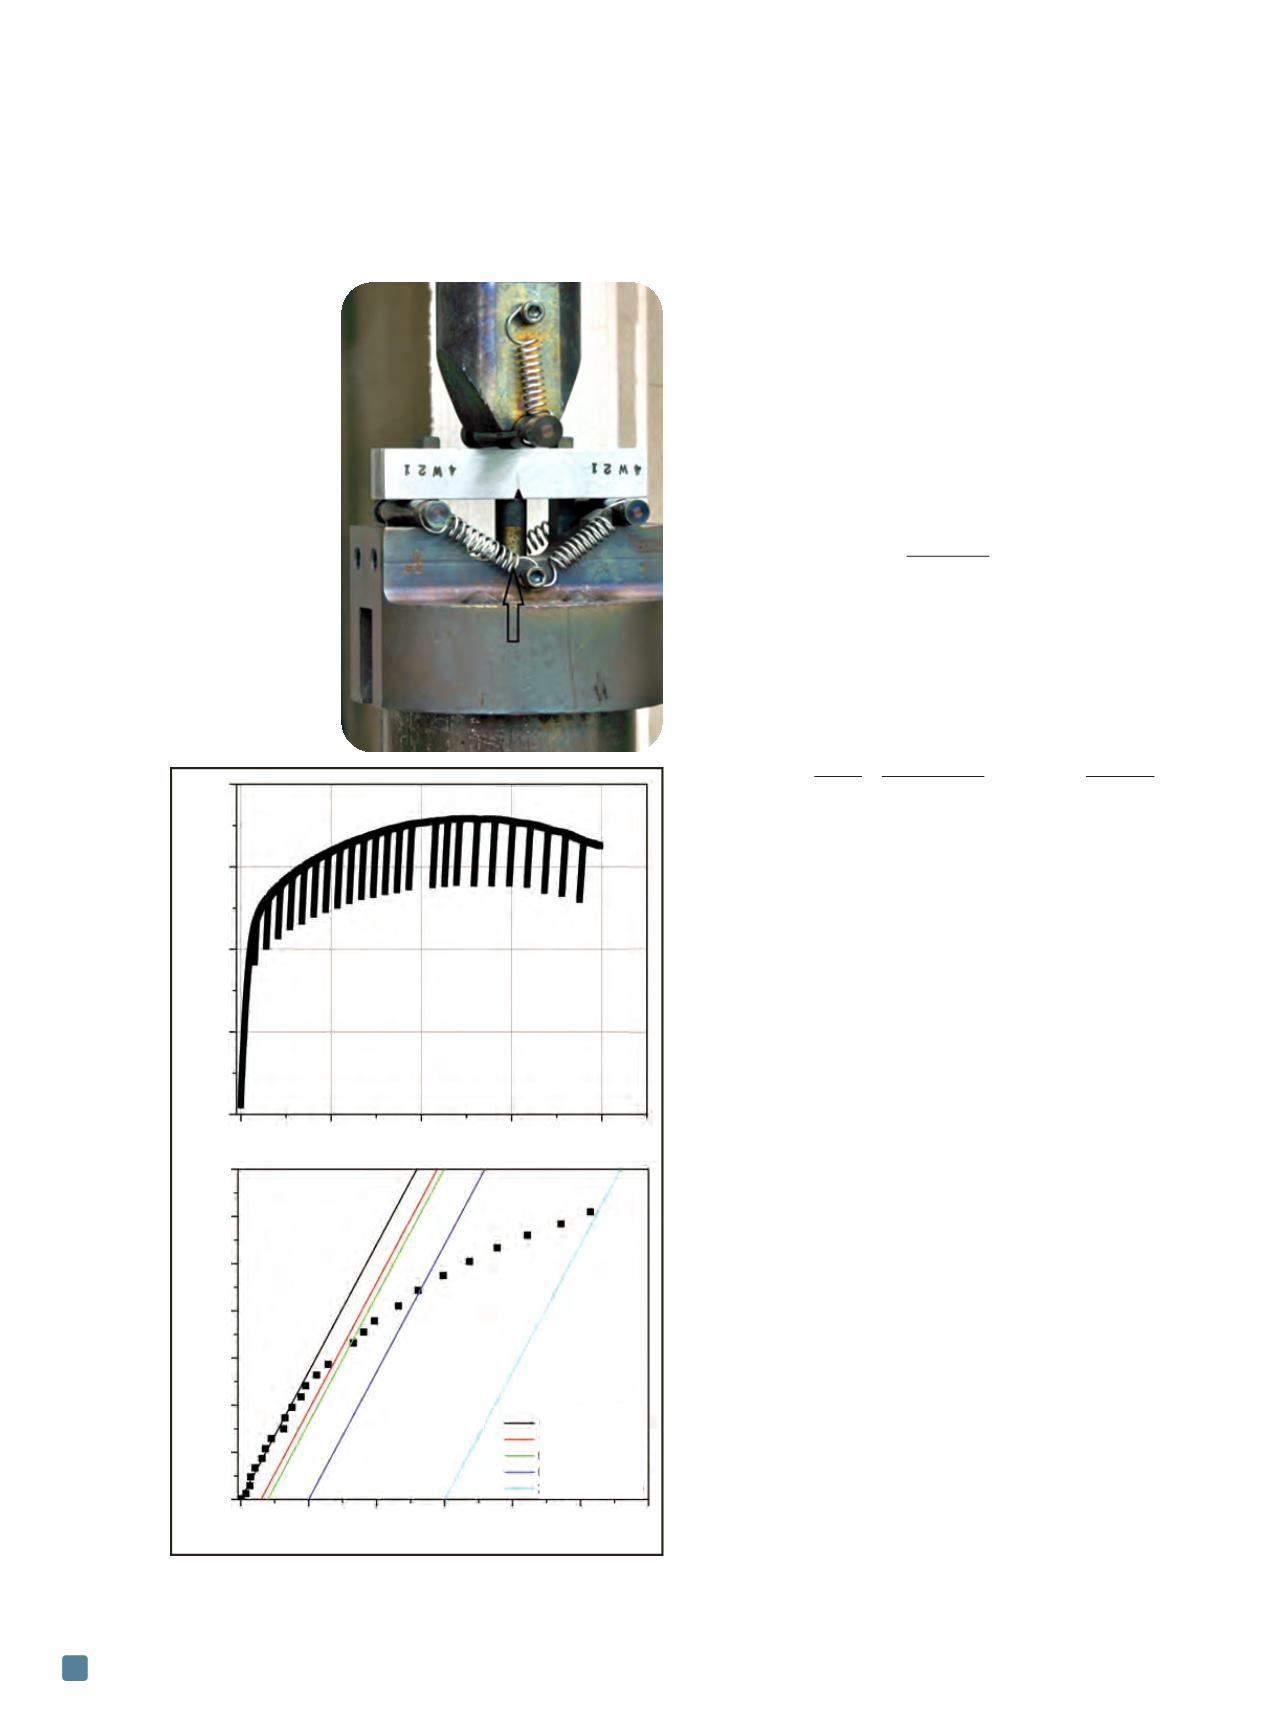

displacement of the SE(B) specimen is measured from the
displacement of the specimen notch root by a LVDT sen-
sor. Alternatively, the CMOD of the SE(B) specimen is
measured by a displacement gage. For both C(T) and
SE(B) specimens, a load cell (not shown in Figs. 3 and 4)
measures specimen load.
Elastic unloading compliance (EUC)
Because a J-R curve consists of two parts,
J-Integral
and
crack growth, determining this curve naturally involves
calculating both aspects. In
elastic unloading compliance
(EUC), the
J-Integral
is calculated as:
(1)
where
J
el(i)
and
J
pl(i)
are the elastic and plastic components
of
J-Integral
, respectively. For
J
el(i)
:
(2)
where
ν
is Poisson’s ratio,
E
is Young’s modulus, and
K
(i)
is
the stress intensity factor.
K
(i)
depends on specimen config-
uration, load level, crack size, and other factors. The equa-
tion for calculating
J
pl(i)
follows:
(3)
where
a
(i)
is the current crack size,
b
(i)
is the unbroken lig-
ament size,
B
N
is the specimen net thickness,
A
pl(i)
is the
plastic area under the load versus load-line displacement
record for the specimen,
η
pl(i-1)
equals 1.9 for a SE(B) spec-
imen and (2+0.522b
(i-1)
/W) for a C(T) or DC(T) specimen,
and
γ
equals 0.9 for a SE(B) specimen and (1+0.76b
(i-1)
/W)
for a C(T) or DC(T) specimen. In order to obtain the real-
time crack growth value, EUC measures the material com-
pliance (the ratio of displacement increment to force
increment) by periodic unloading and reloading of the
specimen. For instance, a typical load-displacement record
for a J-R curve test using EUC is shown in Fig. 5(a). Each
short straight line in Fig. 5(a) represents an unloading-re-
loading sequence. The rest of the curve resembles a load-
displacement curve in a tensile test, i.e., initial elastic
deformation followed by plastic deformation and load drop
after passing the maximum load level. Once the material
compliance value is obtained, equations in ASTM standard
E1820-11
[1]
can be applied to convert the compliance re-
sult to the estimated real-time crack size. Eventually, com-
bining the
J-Integral
and crack growth results yields the J-R
data as shown in Fig. 5(b).
Since its introduction, the EUC method has gained
wide popularity for the J-R curve test. However, EUC still
faces considerable challenges for testing in extreme envi-
ronments. For example, in elevated temperature testing
(above 500°C), the compliance measurement in EUC is af-
fected by the material relaxation behavior and increased
friction between loading clevises and pins, which results
in unreliable crack size measurement. In addition, EUC is
relatively time-consuming due to the periodic unloading-
ADVANCED MATERIALS & PROCESSES •
APRIL 2014
20
Fig. 5 —
(a) Load-displacement record for a J-R curve test with
elastic unloading compliance (EUC); (b) J-R data determined
by EUC.
Fig. 4 —
Apparatus for the
J-R curve test of a
single edge bend
specimen.
J
(i)
= J
el(i)
+ J
pl(i)
K
(i)
2
(1- v
2
)
E
J
el(i)
=
J
pl(i)
=
[
J
pl(i-1)
+
x ] x [1-
γ
pl(i-1)
]
η
pl(i-1)
A
pl(i)
-
A
pl(i-1)
a
(i)
-
a
(i-1)
b
(i-1)
B
N
b
(i-1)
LVDT
0
2
4
6
8
Displacement (mm)
(a)
(b)
16
12
8
4
0
Load (kN)
Construction line
1stexclusion line
0.2mmoffset line
0.5mmoffset line
2ndexclusion line
0.0 0.5 1.0
1.5
2.0
2.5 3.0
D
a (mm)
1400
1200
1000
800
600
400
200
0
J-Integral
(kJ/m
2
)


