


 19 / 50

ADVANCED MATERIALS & PROCESSES •
APRIL 2014
19
Determining Ductile
Fracture Toughness in Metals
D
uctile fracture toughness determina-
tion, such as the
J-integral
vs. crack
growth resistance (J-R) curve, is a use-
ful tool for evaluating a material’s structural
integrity in the presence of preexisting defects.
The J-R curve can calculate the work (energy)
per unit of fracture surface area needed to
drive crack growth. A typical J-R curve is
shown in Fig. 1. From it, the material fracture
toughness near the initiation of stable crack
growth (Jq) can be derived. In addition, tear-
ing modulus (T
R
), representing the material’s
resistance to stable crack growth, can be cal-
culated based on the slope of the J-R curve be-
tween two exclusion lines (dashed red lines in
Fig. 1). Since the introduction of the J-R curve,
there have been extensive efforts devoted to
developing simple and reliable methods to de-
termine this aspect of various materials. This
article briefly reviews three widely used J-R
curve test methods in metals: Elastic unload-
ing compliance (EUC), normalization, and di-
rect current potential drop (DCPD). The main
differences between these methods involve
crack size determination. More details about
performing the J-R curve test can be found in
ASTM standard E1820-11
[1]
.
Specimen configuration
and test apparatus
Different types of specimens can be used
for the J-R curve test. Figure 2 illustrates three
commonly used configurations: A standard
compact C(T) specimen, single edge bend
SE(B) specimen, and standard disk-shaped
compact DC(T) specimen. After machining,
the sample undergoes fatigue precracking to
create the initial sharp crack. Initial crack size is
usually controlled to be ~a/W=0.5 where
a
is
the crack size and
W
is the specimen width. Af-
terwards, side-grooving on both sides of the
specimen (e.g., C(T) and SE(B) specimens in
Fig. 2) is usually performed to ensure a straight
crack front. Total thickness reduction of 20%
(10% on each side) due to side-grooving func-
tions well for many materials.
Both servo-hydraulic and electromechan-
ical load frames can be used for the J-R curve
test. Figures 3 and 4 show the experimental
apparatus for performing this test on a C(T)
and SE(B) specimen, respectively. The exper-
imental setup of a DC(T) specimen is similar
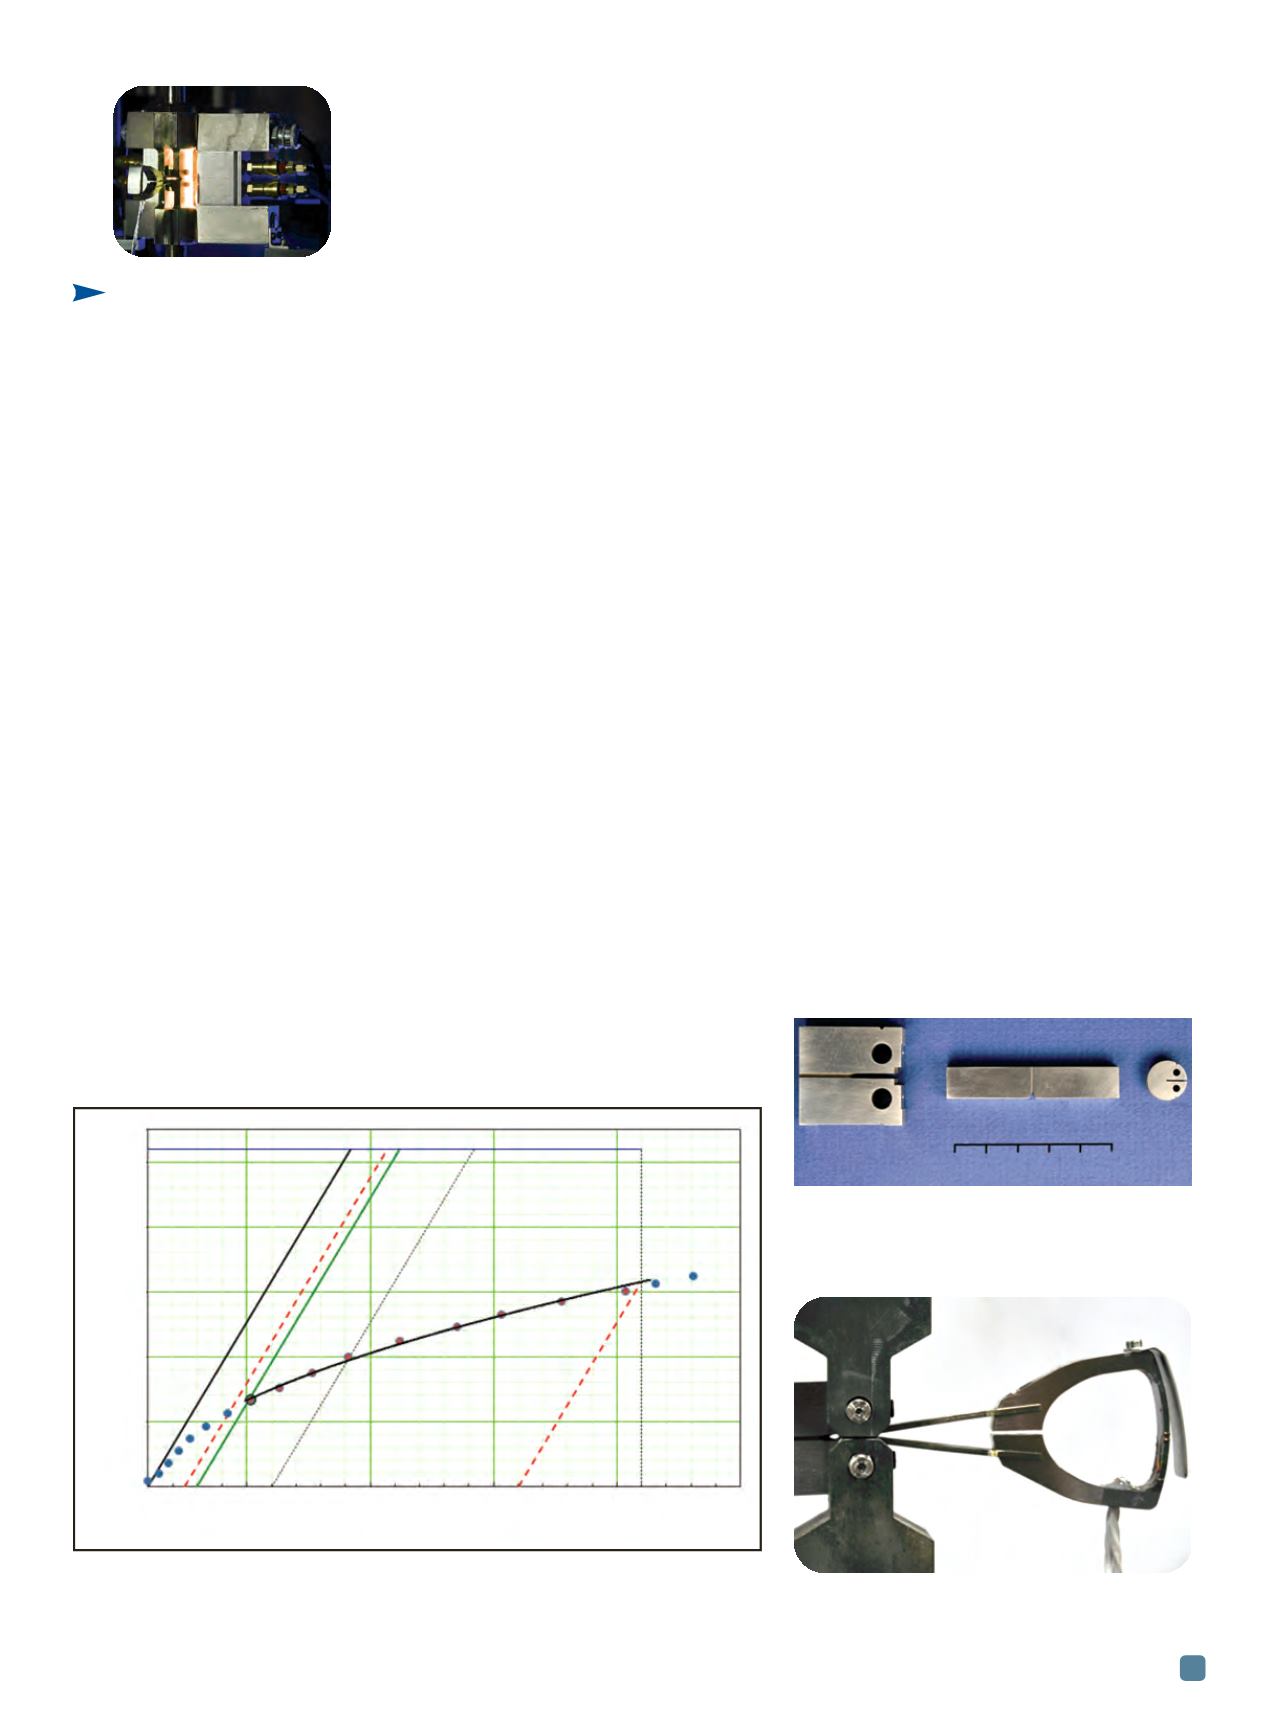
to that of a C(T) specimen. As shown in Fig. 3,
the J-R curve test apparatus for a C(T) speci-
men consists of a pair of clevises with pins for
loading the specimen and a displacement gage
for measuring the specimen’s crack mouth
opening displacement (CMOD). In contrast,
the test fixture for a SE(B) specimen (Fig. 4)
employs a central pin to press the specimen,
plus two roller pins to support it. The load line
Xiang (Frank) Chen
Randy K. Nanstad,
FASM*
Mikhail A. Sokolov
Eric T.
Manneschmidt
Materials Science and
Technology Division,
Oak Ridge National
Laboratory,
Tenn.
Ductile fracture
toughness
testing is useful
for evaluating
a material’s
structural
integrity.
Three different
techniques are
explored here.
*Member of
ASM International
Fig. 1 —
A typical J-R curve shows the fracture
toughness near the initiation of stable crack growth
(Jq) and tearing modulus (T
R
).
Fig. 2 —
Three commonly used specimen
configurations for the J-R curve test. Left to right:
Standard compact C(T) specimen, single edge
bend SE(B) specimen, and standard disk-shaped
compact DC(T) specimen.
Fig. 3 —
Apparatus for the J-R curve test of a
compact specimen.
1000
800
600
400
200
0
-0.1
0.4
0.9
1.4
1.9
2.4
Crack extension
D
a (mm)
J-R curve
T R
OC
dJ/da
J q
J (kJ/m
2
)
SE(B)
DC(T)
C(T)
0 1 2 3 4 5 cm