


 21 / 50

ADVANCED MATERIALS & PROCESSES •
APRIL 2014
21
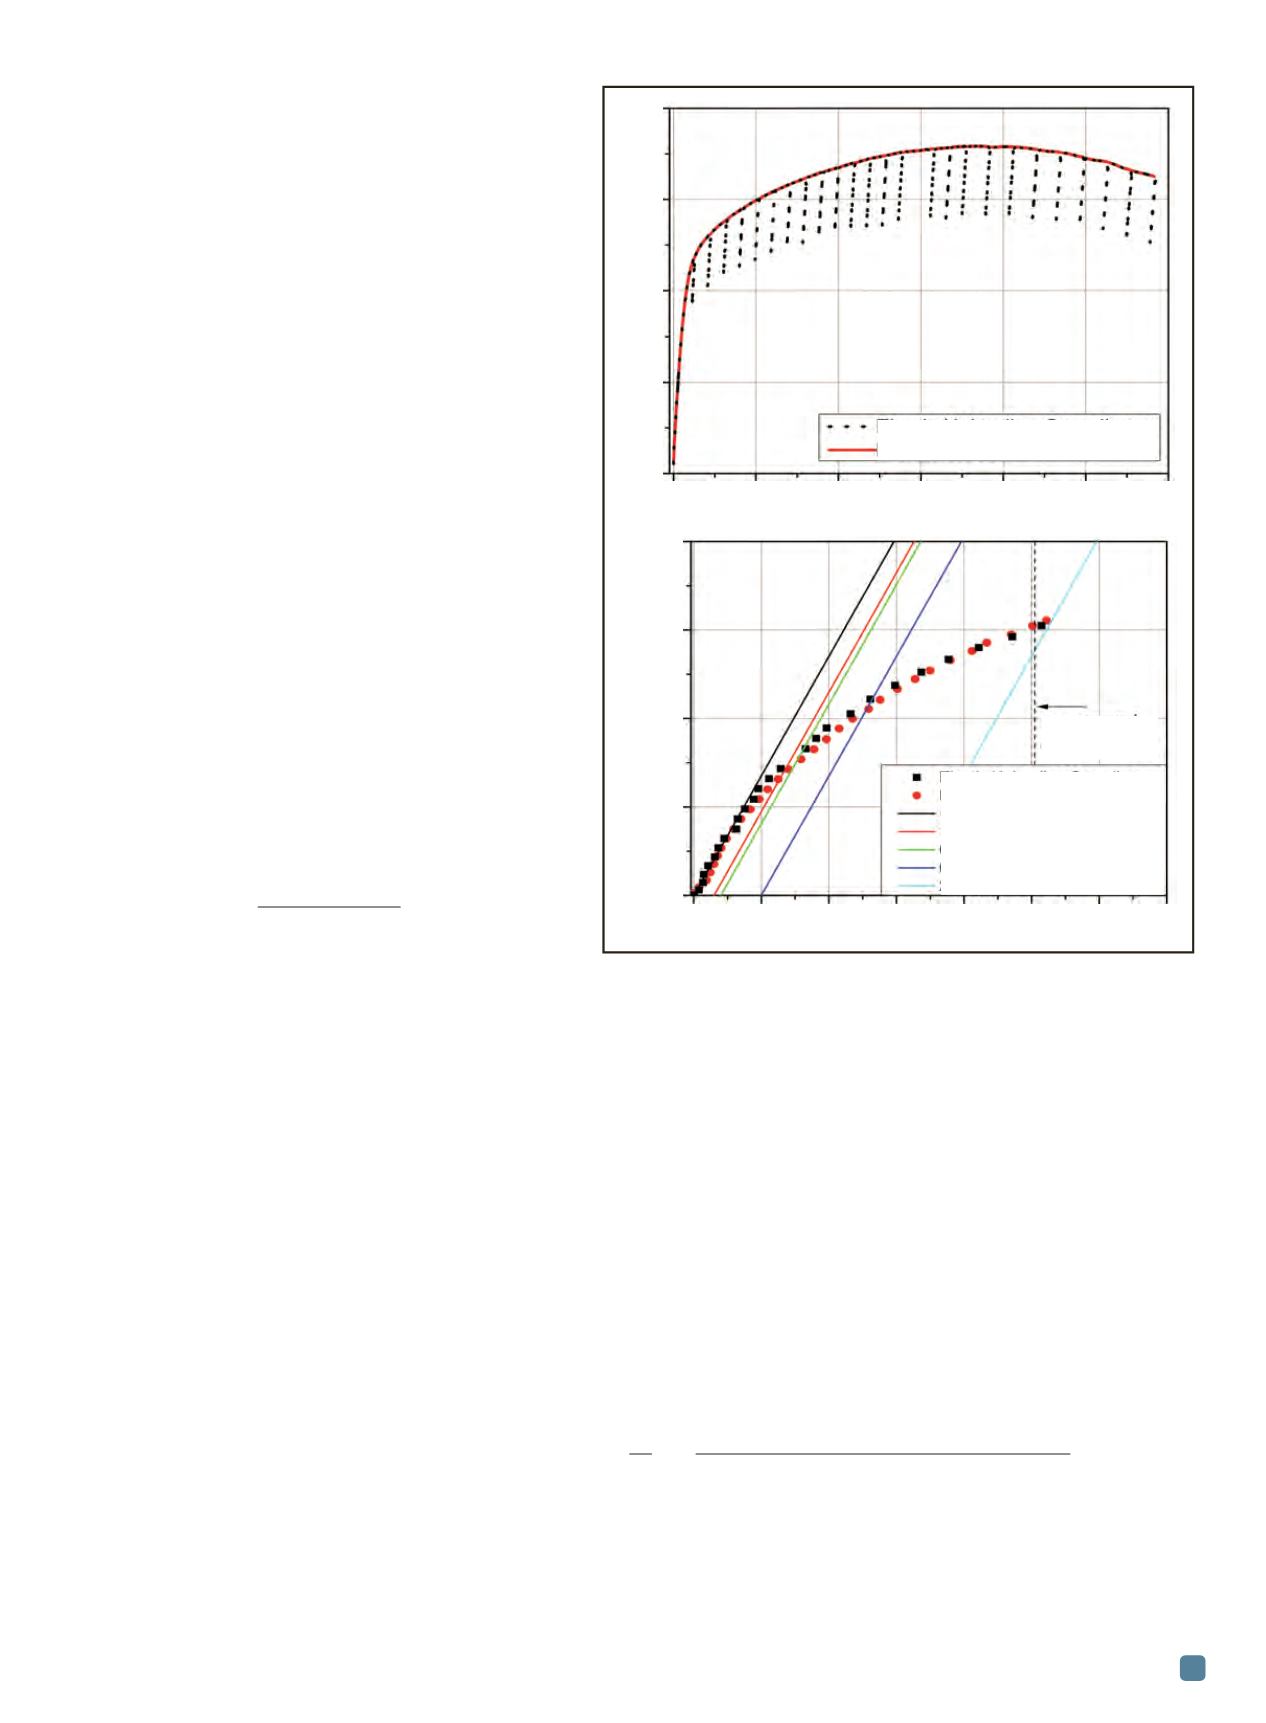
reloading requirement. In order to solve these issues, al-
ternative J-R curve test methods, such as normalization
and DCPD, could be used.
Normalization
The
normalization
technique was initially developed
by Herrera and Landes et al.
[2, 3]
and later studied by Joyce
and Lee
[4, 5]
. In some cases, this method can be applied to
determine a J-R curve directly from a load-displacement
record taken together with initial and final crack size meas-
urements from the specimen fracture surface. Because the
compliance measurement is eliminated, the load-displace-
ment curve in the normalization method does not require
the unloading-reloading portion as in EUC—see Fig. 6(a)—
greatly simplifying the test and reducing test time.
The
J-Integral
calculation for the normalization
method is the same as that in EUC, described previously.
In addition to initial and final crack size measurements, in-
termediate crack sizes are required to derive the full J-R
curve. In the normalization method, detailed procedures
for deriving intermediate crack sizes are lengthy and com-
plicated
[1]
. In principle, the normalized load
(P
Ni
)
and
plastic displacement
(ν
pli
’
)—
both of which are functions of
the current crack size
a
i
—
are calculated first using only
measured initial and final crack size data. After calculation,
the normalized load and plastic displacement are fitted
with the following normalization function:
(4)
where
a, b, c,
and
d
are fitting constants. Afterwards, the
normalized load is recalculated with an assumed crack
size and compared with the normalized load from Eq.
(4). Then the assumed crack size used for calculating the
normalized load is adjusted until the deviation between
the calculated normalized load and the normalized load
from Eq. (4) is within the ±0.1% range. After repeating
this procedure, all intermediate crack sizes are derived
and the J-R curve is determined in the normalization
method, which reveals an excellent agreement with the
J-R curve from EUC. See Fig. 6(b).
The normalization technique is more favorable for tests
with high loading rates or in extreme environments. De-
spite these advantages, this method has a very strict re-
quirement for crack growth—the final physical crack
extension must be within the lesser of 4 mm or 15% of the
initial uncracked ligament
[1]
. Unlike EUC, real-time crack
growth estimates are not available in the normalization
method. Therefore, strict crack growth control may be dif-
ficult to realize during the test for the normalization
method.
Direct current potential drop (DCPD)
As an alternative J-R curve test method
[6-10]
,
direct cur-
rent potential drop
(DCPD) combines the advantages of
both the EUC and normalization methods. It does not re-
quire the unloading compliance measurement, so the load-
displacement test record is simplified and the same as the
normalization method in Fig. 6(a). In addition, DCPD pro-
vides experimental real-time crack size measurements as
in EUC. DCPD relies on passing a constant direct current
through the specimen, then measuring the voltage gener-
ated across an area in the specimen. See Fig. 7(a). As the
crack propagates in the specimen, less area is available for
the passage of the constant current, resulting in an increase
of the effective electrical resistance and potential measure-
ment, i.e., the potential drop in Fig. 7(b). Thus, a correla-
tion can be made between crack length and potential drop
in DCPD. In order to convert the potential drop measure-
ment to the crack size, Johnson’s equation is usually ap-
plied
[11-12]
:
(5)
where
a
is the crack length corresponding to potential
drop
U, W
is specimen width,
y
is one-half of the poten-
tial gage span, and
a
0
and
U
0
are initial crack length and
potential drop, respectively. During the J-R curve test
Fig. 6 —
(a) EUC vs. normalization load-displacement record for the J-R
curve test; (b) comparison of J-R curves derived by EUC and normalization.
P
Ni
=
a + bv
pli
’
+ cv
pli
’
2
d + v
pli
’
a =
cos
-
1
2W
cosh(
p
y
/
2W
)
p
cosh{(
U
/
U
0
)cosh
-1
[cosh(
p
y
/
2W
)/cos(
p
a
0
/
2W
)]}
(a)
(b)
Elastic unloading compliance
Normalization
0
1
2
3
4
5
6
Displacement (mm)
16
12
8
4
0
Load (kN)
Measured
crack length
Elastic unloading compliance
Normalization
Construction line
1st exclusion line
0.2 mm offset line
0.5 mm offset line
2nd exclusion line
0.0 0.5 1.0
1.5
2.0
2.5
3.0
3.5
D
a (mm)
1600
1200
800
400
0
J-Integral
(kJ/m
2
)