


 33 / 58

edfas.org
33
ELECTRONIC DEVICE FAILURE ANALYSIS | VOLUME 19 NO. 2
changeswith the sample thickness, as expected; however,
the overall signal-to-noise ratio is sufficient to accurately
identify the material over the whole thickness range.
This reflects the excellent sensitivity of the resonance-
enhanced mode for characterizing thin samples.
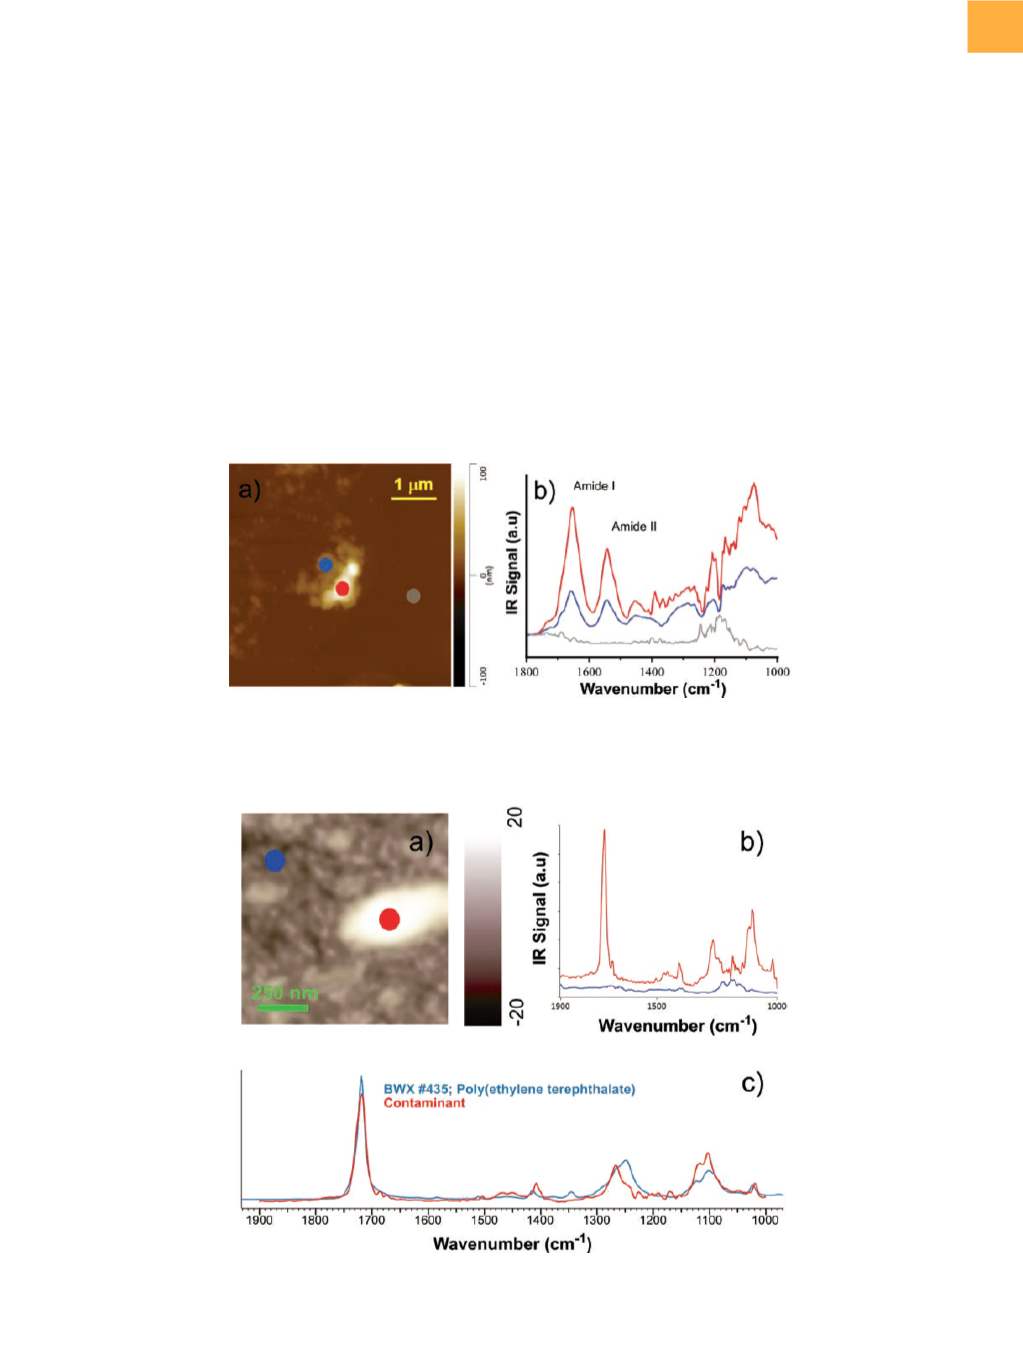
Resonance-enhanced AFM-IR spectra on a second
sample are shown in Fig. 3 after locating the surface
contamination by regular AFM. Observed spectra are
compared against the Fourier transform infrared (FTIR)
database (KnowItAll, Bio-Rad Inc.) and positively iden-
tified as polyethylene terephthalate (PET), a polymer
typically used in polyester fabric. Figure 3 (also Fig. 2)
illustrates that fast spectral acquisition does not affect
spectral resolution and sensitivity.
CONCLUSIONS AND FUTURE
Resonance-enhanced AFM-IR has been demonstrated
as a powerful characterization tool for identifying organic
contamination in semiconductor fabrication. It offers
superior sensitivity for organicmaterials with high spatial
resolution compared to traditional analytical tools used
in failure analysis. In addition, truemodel-free correlation
with traditional FTIR spectra augments the reliability of
nanoscale defect characterization.
New-generation AFM-IR technology, such as tapping
AFM-IR and hyperspectral measurements, is currently
under progress. These developments facilitate enhanced
Fig. 2
(a) Tapping-mode AFM image (height) of human skin residue on a siliconwafer. (b) Corresponding AFM-IR spectra. Amide
I and II bands are indicated.
Fig. 3
(a) Tapping-mode height image of another wafer with organic residue. (b) AFM-IR spectra on (red) and off (blue) the
contaminant. (c) Comparison of themeasured AFM-IR spectra (red) of the organic residue against the FTIR spectra (blue)