


 6 / 62

A D V A N C E D M A T E R I A L S & P R O C E S S E S | M A R C H 2 0 1 6
6
MARKET SPOTLIGHT
FEEDBACK
IMMIGRANTS PLAY GROWING PART IN U.S.
SCIENTIFIC WORKFORCE
According to new data from the
National Science Foundation (NSF),
the number of scientists and engi-
neers residing in the U.S. rose from
21.6 million to 29 million between
2003 and 2013. The increase includes
significant growth in the number
of immigrants, from 3.4 million to
5.2 million. Immigrants went from
making up 16% of the science and en-
gineeringworkforce to 18%, according
to a new report from NSF’s National
Center for Science and Engineering
Statistics (NCSES). In 2013, the latest
year studied, 63% of U.S. immigrant
scientists and engineers are natural-
ized citizens, while 22% are perma-
nent residents and 15%are temporary
visa holders. Birthplaces include:
• 57% born in Asia
• 20% born in North America
(excluding the U.S.), Central
America, the Caribbean, or South
America
• 16% born in Europe
• 6% born in Africa
• Less than 1% born in Oceania
Among Asian countries, India
continues its trend of being the top
country of birth for immigrant scien-
tists and engineers, with 950,000 out
LOST IN TRANSLATION
The October issue cover story, “Failure Anal-
ysis of a Fractured Pin,” is an important topic,
but the article was disappointing. The first
paragraph states, “Specifically, the owner of
the failed pin wanted to determine if inclu-
sions may have caused the failure, if the part
had been properly heat treated, and whether
or not the steel composition was correct.”
Three clear questions. Yet nowhere did I find
the answer to any of them.
Irving W. Glater, P.E.
[The pin was tested for chemical composition
and results indicate that the part met the
requirements for Werkstoffnummer 1.4057
Alloy X17CrNi16- 2 steel. No anomalies were
present in the pin’s composition that would
contribute to cracking. This information was an
unfortunate casualty of the editing process. In
the original report, many more metallographic
images of the part, in the as polished condition,
illustrate that the inclusion content of the steel
was low and not a significant contributing fac-
tor to the failure. The report makes it clear that
cracking progressed longitudinally along the
semi-continuous stringers of delta ferrite and it
was the presence of delta ferrite, not the inclu-
sions, that resulted in the brittle behavior the
pin exhibited in the longitudinal direction. Re-
garding heat treatment, neither I nor my client
had access to the thermal history of the part, as
their supplier did not provide this information.
In the process of trimming the original report
from 4358 words, 63 images, and five tables to
an article under 800 words, 10 images, and no
tables, important information and details of the
investigation were lost.
—Craig Schroeder, P.E.]
We welcome all comments
and suggestions. Send letters to
frances.richards@asminternational.org.
of Asia’s total 2.96million. India’s 2013
figure represents an 85% increase
from 2003. Also since 2003, the num-
ber of scientists and engineers from
the Philippines increased 53% and
the number from China, including
Hong Kong andMacau, increased 34%.
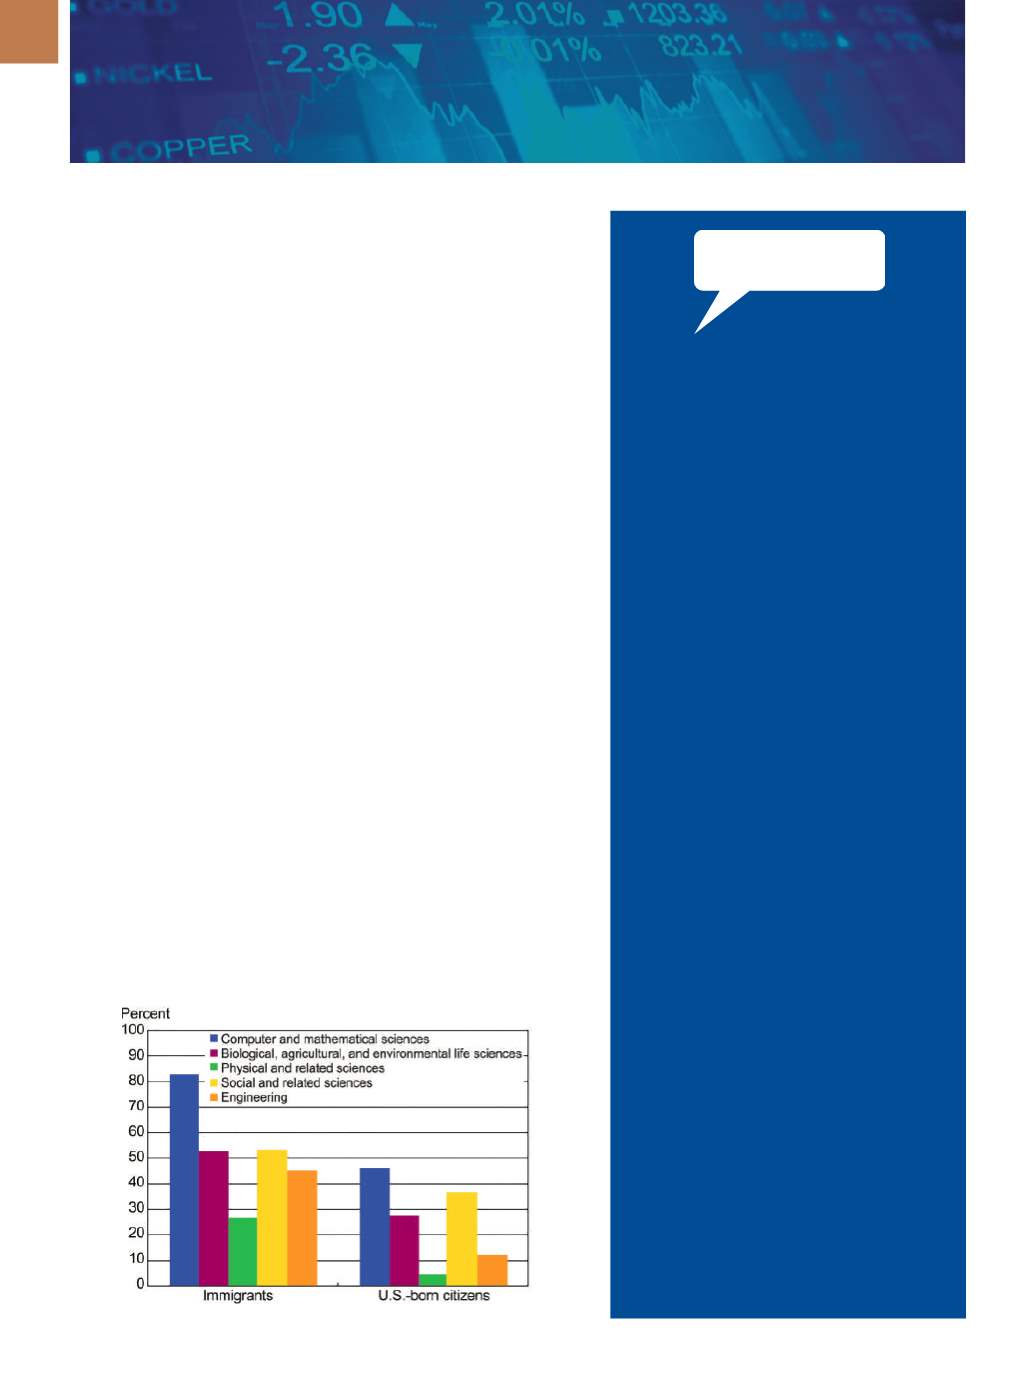
The NCSES report finds that
immigrant scientists and engineers
were more likely to have earned
post-baccalaureate degrees than
their U.S.-born counterparts. In
2013, 32% of immigrant scientists
report their highest degree was a
master’s (compared to 29% of U.S.-
born counterparts) and 9% report it
was a doctorate (compared to 4% of
U.S.-born counterparts). The most
common fields of study for immi-
grant scientists and engineers in
2013 include engineering, computer
and mathematical sciences, and so-
cial and related sciences. More than
80% of immigrant scientists and
engineers were employed in 2013:
The largest share (18%) worked in
computer and mathematical sci-
ences, while the second-largest
share (8%) worked in engineering.
For more information, visit
nsf.gov/ statistics/2015/nsf15328.
Growth in Highest Degree for Scientists and Engineers, 2003-2013
Source: NSF/Scientists and Engineers Statistical Data System, 2013.