


 41 / 62

A D V A N C E D
M A T E R I A L S
&
P R O C E S S E S | J U N E
2 0 1 5
4 1
9
FEATURE
RGA SCANS OF VACUUM FURNACE
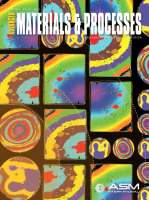
Logarithmic and linear plots of residual gases detect-
ed using RGA in a typical vacuum furnace pumped down to
the 10
−
4
torr range are shown in Figs. 3 and 4, respectively.
In Fig. 3, water has an atomic mass of 18 (hydrogen = 1
×
2
= 2, plus oxygen = 16 for a total of 18). The logarithmic plot
clearly shows residual gases compared to residual water va-
por, while the linear scale plot (Fig. 4) shows that water is the
major player.
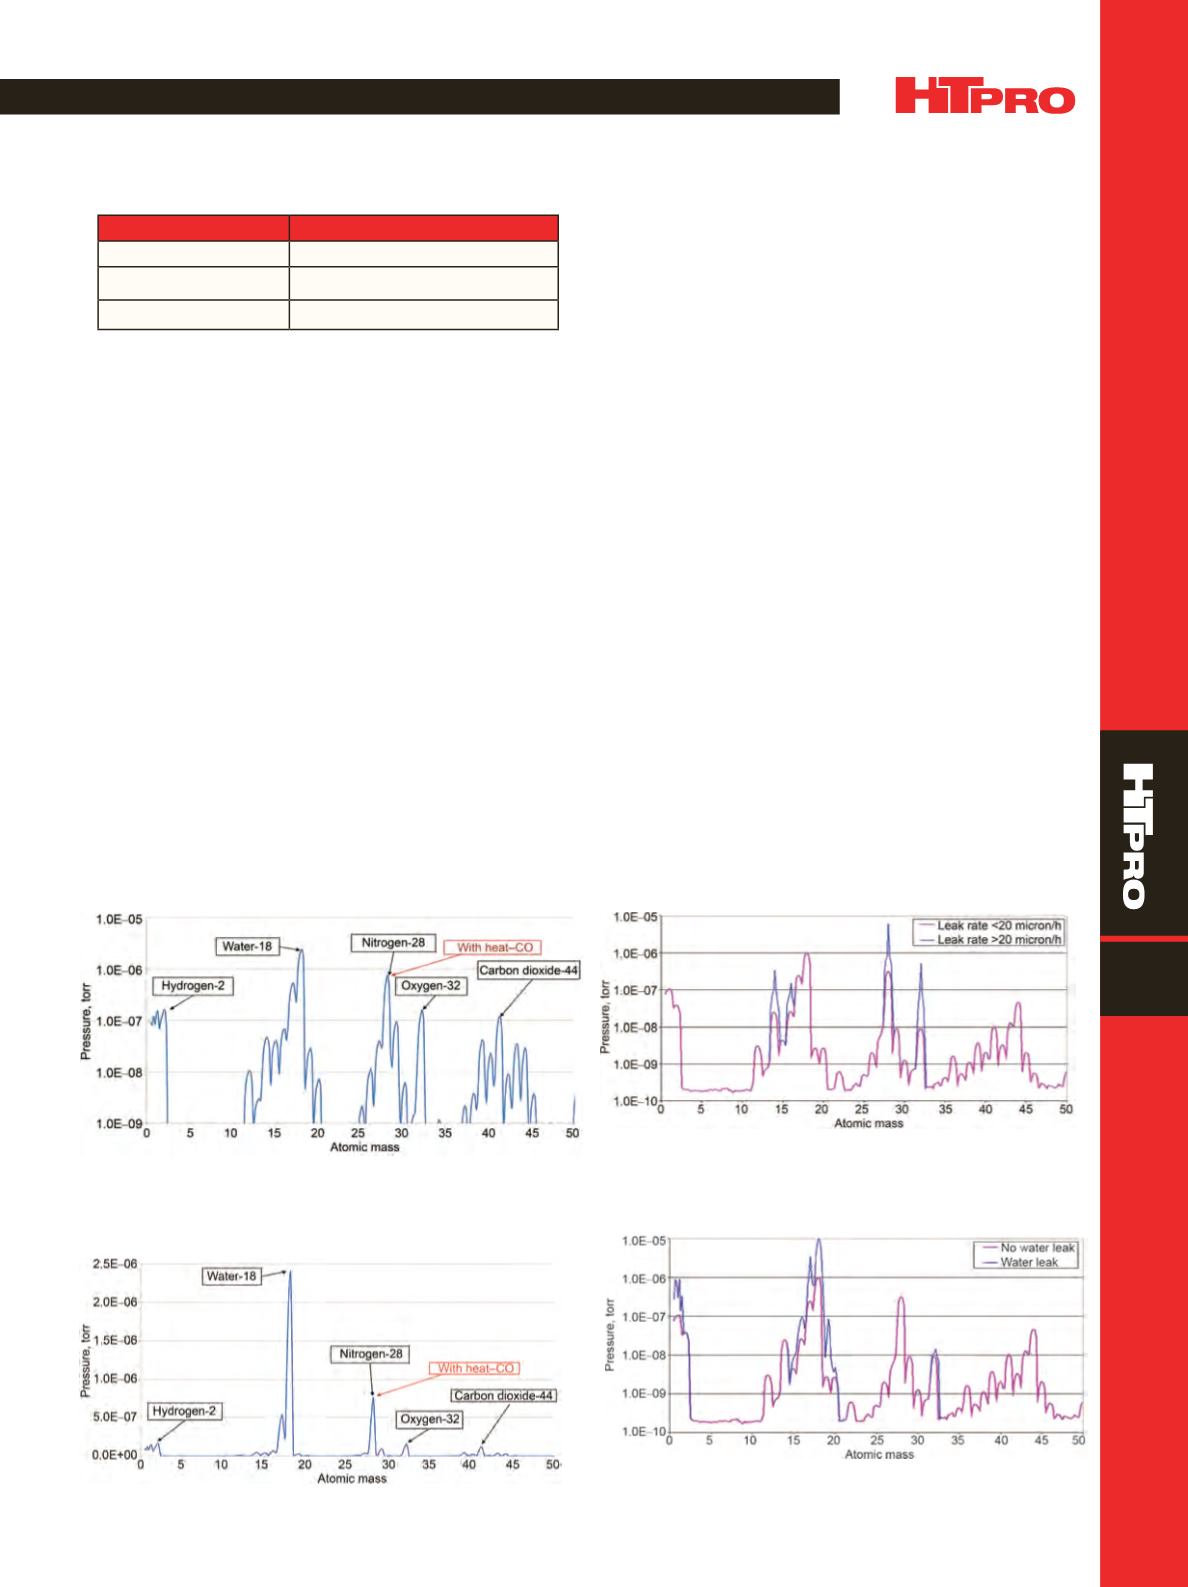
TYPES OF VACUUM FURNACE LEAKS
Vacuum furnaces are prone to air and water leaks. An
RGA is used to help determine what type of leak is occur-
ring. Most involve some type of air leak due to bad seals and
joints. An air leak less than 20 microns/h is acceptable, while
a higher leak rate indicates a more serious problem. Figure 5
shows two RGA plots that reflect acceptable and unaccept-
able conditions. The atomic masses of nitrogen and oxygen
peak with a serious air leak.
Figure 6 is anRGA plot of a furnacewater leak. The high-
est peak is for the water residual component.
ALL-METAL VS. GRAPHITE HOT ZONES
Many vacuum furnace processes require a very deep
vacuum and minimal residual carbon gas to prevent con-
tamination of the final product surface. Identical laboratory
furnaces with 10-in. diameter by 18-in. long hot zones were
used to determine relative residual gases remaining in the
furnaces. One furnace had a graphite-insulated hot zone
with graphite elements, and the other had an all-metal mo-
lybdenum/stainless steel shielded design withmolybdenum
elements. The furnaces had identical pumping systems us-
ing Varian 8-in. diffusion pumps.
Prior to residual gas analysis, both furnaces were pre-
pared as follows:
1. Bake out at 2250°F for 2 h and vacuum cool to <125°F
2. Open furnace door for 5 min
3. Pump down to 5 x 10
−
5
torr
4. Ramp up at 20°F/min to 2200°F
5. Hold for 1 h
Figure 7 shows a log scale plot of ambient temperature
residual gas analysis results for both furnaces. Results indi-
cate that air components and carbon are more prevalent in
the graphite-insulated furnace. This is expected due to the
higher surface area of the graphite felt material than the
Major gas loads present inhighvacuumare shownhere:
Pressure, torr
Major gas load
10
−3
Water vapor (75-95%)
10
−7
H
2
O, CO, CO
2
10
−10
CO, H
2
Fig. 3 —
Residual gas analysis log scale plot of residual gases.
Fig. 4 —
Residual gas analysis linear scale plot of residual gases.
Fig. 5 —
Residual gas analysis for a furnace with an acceptable air
leak rate and serious leak rate.
Fig. 6 —
Residual gas analysis for a furnace with and without a
water leak.