


 6 / 62

A D V A N C E D M A T E R I A L S & P R O C E S S E S | J U L Y / A U G U S T 2 0 1 6
6
MARKET SPOTLIGHT
FEEDBACK
HIGH PERFORMANCE ALLOYS MARKET
TOREACH $11.33 BILLION BY 2024
The high performance alloys mar-
ket is expected to reach $11.33 billion
by 2024, according to a new report from
Grand View Research Inc., San Francisco.
The market is forecast to experience
significant growth due to titanium- and
aluminum-based high performance
alloys replacing steel and other alloys.
Platinum group metal alloy advance-
ments have increased their demand. For
example,
platinum-palladium-copper
alloys are used in wrought products,
significantly reducing costs. Further,
ruthenium-platinum-palladium alloys
are increasingly used in industrial appli-
cations due to high oxidation resistance
and superior strength. Key findings in
the report include:
•
Non-ferrous high performance
alloys are expected to be the fast-
est growing segment, forecast at
a CAGR of over 3% from 2016 to
2024.
•
The electrical and electronics seg-
ment was valued at over $6 billion
in 2015. High performance alloys
used in this industry are added
to conductive metals to optimize
efficiency.
BEWARE OF BERYLLIUM
I recently read the article “Beryllium
Optics Enable Advanced Space Tele-
scopes” from the September 2015 issue.
The article is excellent except for one
item: It does not mention the extreme
toxicity of beryllium or its horribly long
latency period of 20-40 years. I am one of
its victims. Of the various satellites I have
worked on, the Hubble Space Telescope
used virtually no berylliumdue to the
objections of Michael Krim, the engineer
responsible for its basic design.
Inmy opinion, beryllium should nev-
er be used again. Due its terrible effects,
I cannot walk 50 steps without sitting
down. I was never informed of its use or I
would have voicedmy opposition. In addi-
tion, the Occupational Safety and Health
Administration (OSHA) was never notified
of our usage for the satellites and they
cannot act if it is more than six months
since the cause of the complaint occurred.
At six months, there is no evidence at all.
X-rays are of no use. There is only a blood
test for “sensitization to beryllium.”
Other materials such as aluminum/
silicon carbide can take the place of beryl-
lium, so why use it at all? It is the latency
aspect that makes it so dangerous, as
well as the incredibly small amount of
dust that can be tolerated—less than
one milligramper cubic meter per day.
It makes arsenic seem like baby candy.
So the James Webb Space Telescope is
doomed from the start. One cannot ruin
the health of one’s fellowman and expect
no consequences.
Name withheld for privacy
We welcome all comments
and suggestions. Send letters to
frances.richards@asminternational.org.
•
The Asia Pacific region is expected
to exhibit the highest growth due
to increasing demand in emerging
economies and rapid industrializa-
tion in Indonesia, India, and China.
•
Europe accounted for a market
share of over 26% in 2015 and is
forecast to witness strong growth
over the next eight years due to
growing demand in the automotive
and aerospace industries.
•
Superalloys are expected to grow
by more than 4.5% from 2016 to
2024. Increased use in power plants,
chemical and petrochemical pro-
cessing, and the oil and gas industry
is expected to spur demand over the
next eight years.
For more information on “High
Performance Alloys Market Analysis by
Product (Non-Ferrous Alloys, Platinum
Group Metal Alloys, Refractory Metal
Alloys and Superalloys), by Application
(Aerospace, Automotive, Industrial Gas
Turbines, Industrial, Oil & Gas, Electron-
ic), by Material (Aluminum, Titanium,
Magnesium) and Segment Forecasts to
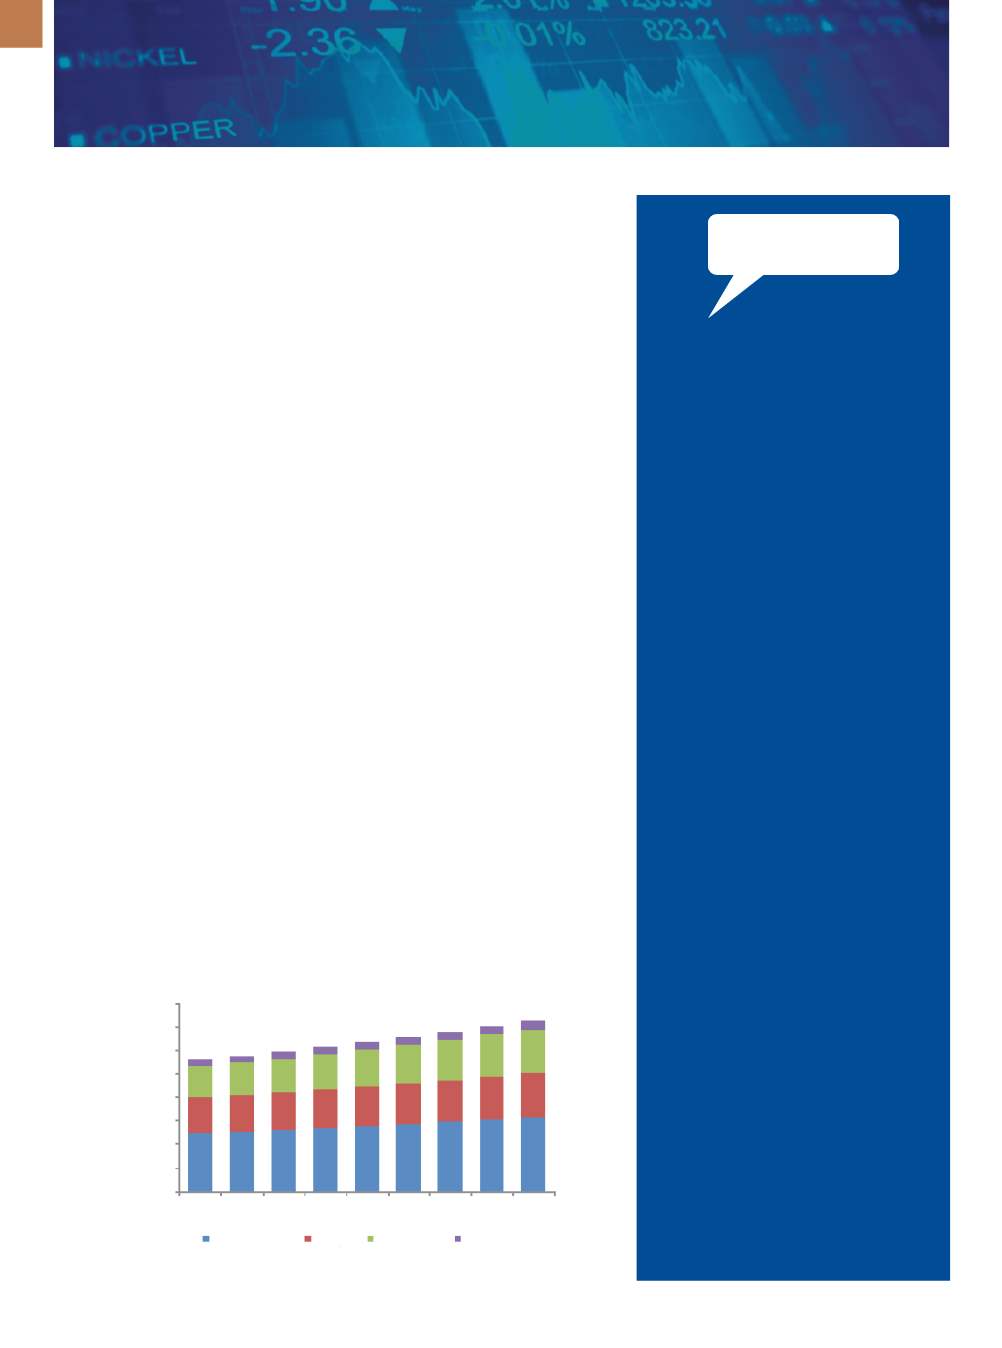
2024,” visit grandviewresearch.com.HighPerformanceAlloysMarketRevenuebyRegion, 2012-2020($Million)
Courtesy of Grand View Research Inc.
1600
1400
1200
1000
800
600
400
200
0
2012 2013 2014 2015 2016 2017 2018 2019 2020
North America Europe Asia Pacific Rest of World