


 23 / 86

A D V A N C E D
M A T E R I A L S
&
P R O C E S S E S |
A P R I L
2 0 1 6
2 3
TABLE 2
—
FREQUENCY OF GRAINS WITH SLIP SYSTEM
ACTIVATION WITHIN MATERIAL AND CONDITION
Sample
number
Condition
Loading
direction
%
with
{0001}
%
with
{1010}
%
with
{1011}
%
with
{1122}
1
Q + A (a)
Longitudinal
10
30
30
50
2
Annealed (b)
Longitudinal
10
55
60
45
3
Annealed
Radial
20
20
55
40
4
Annealed
Shear
15
10
50
60
5
Annealed Longitudinal
15
55
55
70
6
Q + A
Longitudinal
10
15
60
55
7
Annealed Longitudinal
20
20
70
75
8
Q + A
Longitudinal
15
40
60
50
9
Annealed Longitudinal
10
50
75
35
(a) Q+A =
α
/
β
solution treated, quenched, and aged. (b)
α
+
β
annealed structure.
comparison, graphical slip band analy-
sis is a surface technique to study a sur-
face exposed to deformation. As such,
graphical slip band analysis might not
show the same results due to the nature
of the free surface during deformation.
Basedondata inTable 2, quenched
and aged microstructures demonstrate
a higher number of grains with {1122}
slip bands. Similarly, radial and shear
loading appears to decrease the num-
ber of grains demonstrating {1010} slip
bands. Finally, there is a significantly
greater number density of slip bands
and twinning in samples 6 and 7, which
had both lower aluminum content than
all other samples, and lower nominal
oxygen content than all samples except
sample 5. This confirms the general
trend that higher strength alloys tend to
have fewer activated slip bands, with a
greater overall intensity of deformation
on the remaining slip bands.
HR-EBSD results differ both from
that reported in the literature on disloca-
tion content visible in TEM and from slip
band EBSD mapping. The latter could
be explained by the differences of stress
state due to the free surface during de-
formation, while the former may be due
to image forces acting upon more mo-
bile edge dislocations in TEM foils during
analysis. The same trend with edge ver-
sus screwdislocation content in HR-EBSD
and TEM analysis has been observed in
other materials using CrossCourt soft-
ware. Further investigations could be un-
dertaken to prove the enhanced mobility
of edge dislocations in TEM foils using
ECCI on a TEM foil and a bulk sample to
compare the dislocation content.
HR-EBSD results show significant-
ly more basal slip thanmeasurement by
slip trace analysis, and less {1011} and
{1122} slip bands. This disparity might
be due to differences in the accuracy
of each technique, differences in EBSD
acquisition variables, or stress state at
the free surface; and could be further
explored by analyzing smaller strain
levels using both techniques. A differ-
ence in slip banding near surfaces could
be an important consideration for frac-
ture initiation mechanisms, such as in
fatigue, where cracks may originate at
either surface or subsurface sites.
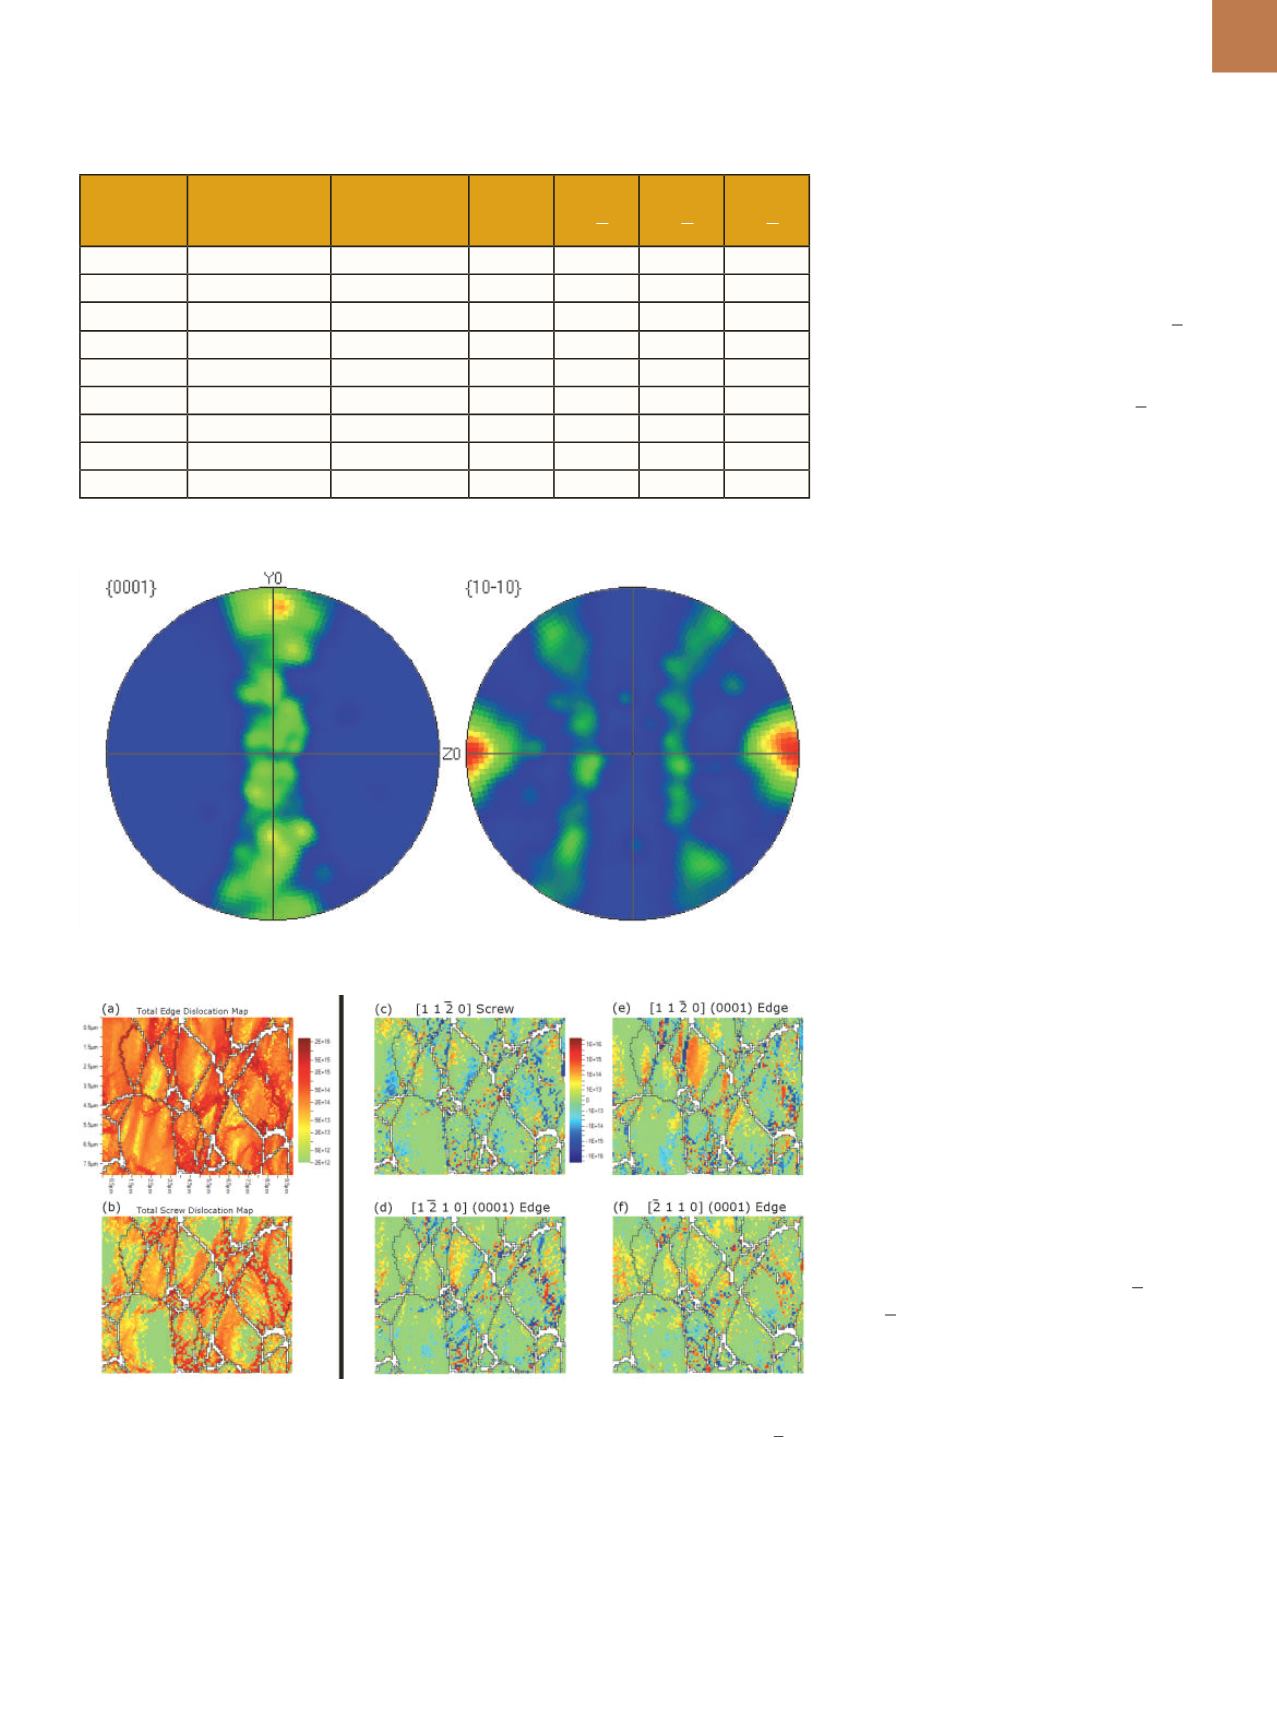
Fig. 2 —
Pole figures generated from Sample 4. Wire longitudinal axis is aligned with Z0.
Fig. 3 —
Dislocation density analysis fromHR-EBSD technique for Sample 4. Direction of wire
longitudinal axis in maps is vertical. (a) Calculated edge dislocation content is larger than
(b) total screw dislocation content from all slip systems. (c) Screw dislocation content of [1120]
character. (d-f) Basal edge dislocation content fromdifferent vectors of basal dislocations.
materials, such as within the subsurface
of a fatigue sample
[8]
. The technique re-
quires preparation of only one polished
surface rather than two surfaces closely
spaced together like in TEM. Having
only one surface reduces the effect
of strain relaxation, which can occur
during soft-materials TEM analysis. By